Immigrants from Eastern Europe vs South American Seniors Poverty Over the Age of 75
COMPARE
Immigrants from Eastern Europe
South American
Seniors Poverty Over the Age of 75
Seniors Poverty Over the Age of 75 Comparison
Immigrants from Eastern Europe
South Americans
12.6%
SENIORS POVERTY OVER THE AGE OF 75
16.0/ 100
METRIC RATING
196th/ 347
METRIC RANK
14.1%
SENIORS POVERTY OVER THE AGE OF 75
0.0/ 100
METRIC RATING
264th/ 347
METRIC RANK
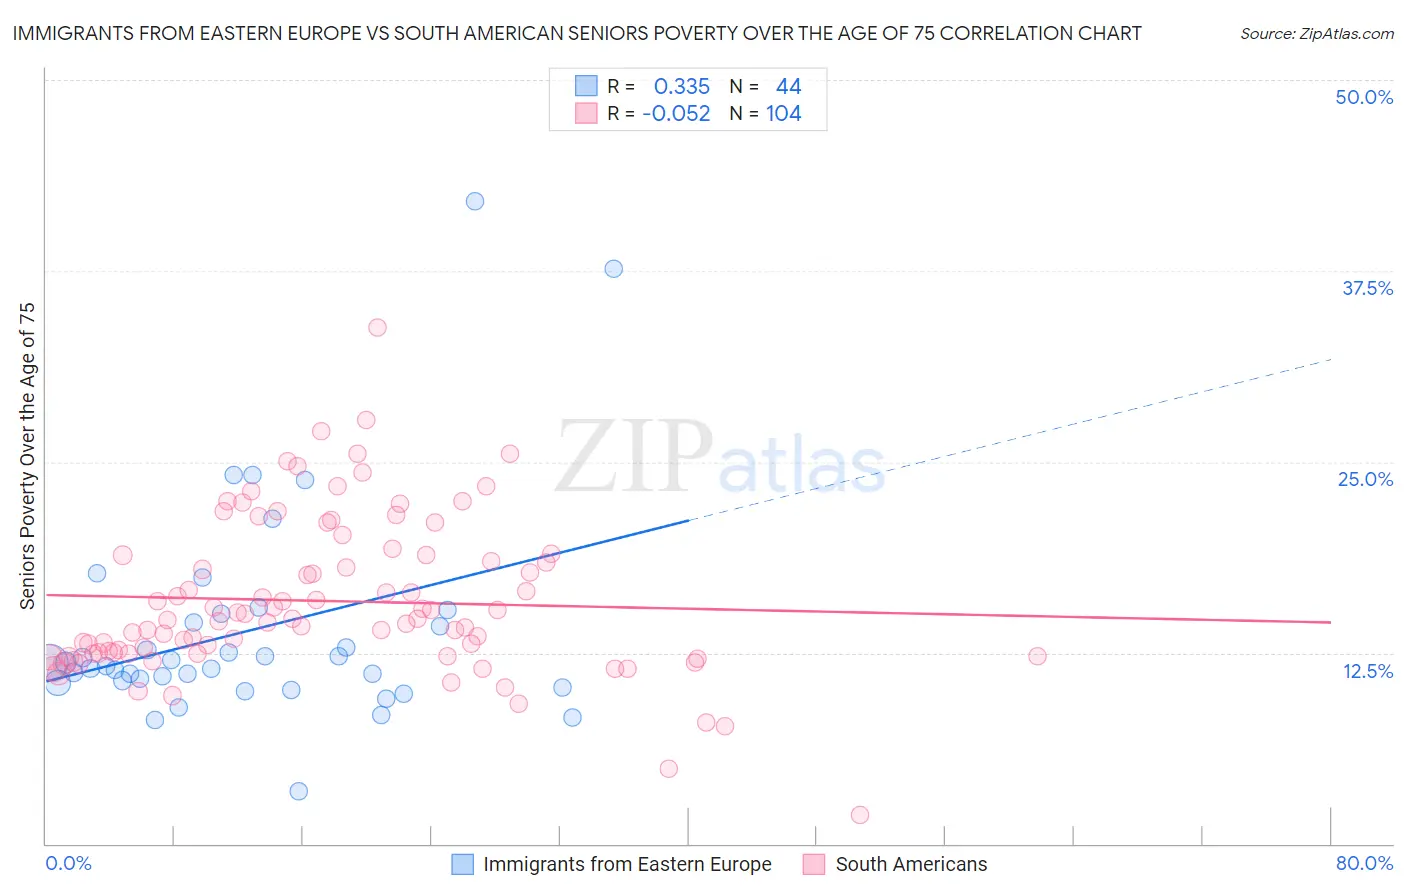
Immigrants from Eastern Europe vs South American Seniors Poverty Over the Age of 75 Correlation Chart
The statistical analysis conducted on geographies consisting of 467,331,078 people shows a mild positive correlation between the proportion of Immigrants from Eastern Europe and poverty level among seniors over the age of 75 in the United States with a correlation coefficient (R) of 0.335 and weighted average of 12.6%. Similarly, the statistical analysis conducted on geographies consisting of 485,273,112 people shows a slight negative correlation between the proportion of South Americans and poverty level among seniors over the age of 75 in the United States with a correlation coefficient (R) of -0.052 and weighted average of 14.1%, a difference of 12.2%.
Seniors Poverty Over the Age of 75 Correlation Summary
| Measurement | Immigrants from Eastern Europe | South American |
| Minimum | 3.4% | 1.9% |
| Maximum | 42.0% | 33.8% |
| Range | 38.6% | 31.9% |
| Mean | 13.9% | 15.9% |
| Median | 11.8% | 14.7% |
| Interquartile 25% (IQ1) | 10.6% | 12.5% |
| Interquartile 75% (IQ3) | 14.8% | 18.9% |
| Interquartile Range (IQR) | 4.2% | 6.4% |
| Standard Deviation (Sample) | 7.1% | 5.1% |
| Standard Deviation (Population) | 7.0% | 5.1% |
Similar Demographics by Seniors Poverty Over the Age of 75
Demographics Similar to Immigrants from Eastern Europe by Seniors Poverty Over the Age of 75
In terms of seniors poverty over the age of 75, the demographic groups most similar to Immigrants from Eastern Europe are Immigrants from France (12.6%, a difference of 0.19%), Alsatian (12.6%, a difference of 0.23%), Taiwanese (12.6%, a difference of 0.24%), Nepalese (12.6%, a difference of 0.26%), and Chilean (12.6%, a difference of 0.37%).
| Demographics | Rating | Rank | Seniors Poverty Over the Age of 75 |
| Immigrants | Indonesia | 24.4 /100 | #189 | Fair 12.5% |
| Immigrants | Congo | 23.9 /100 | #190 | Fair 12.5% |
| Liberians | 23.2 /100 | #191 | Fair 12.5% |
| Choctaw | 20.2 /100 | #192 | Fair 12.5% |
| Taiwanese | 17.8 /100 | #193 | Poor 12.6% |
| Alsatians | 17.7 /100 | #194 | Poor 12.6% |
| Immigrants | France | 17.4 /100 | #195 | Poor 12.6% |
| Immigrants | Eastern Europe | 16.0 /100 | #196 | Poor 12.6% |
| Nepalese | 14.4 /100 | #197 | Poor 12.6% |
| Chileans | 13.7 /100 | #198 | Poor 12.6% |
| Immigrants | Lebanon | 12.7 /100 | #199 | Poor 12.7% |
| Immigrants | Vietnam | 12.1 /100 | #200 | Poor 12.7% |
| Paraguayans | 11.1 /100 | #201 | Poor 12.7% |
| Arapaho | 10.9 /100 | #202 | Poor 12.7% |
| Immigrants | Southern Europe | 10.7 /100 | #203 | Poor 12.7% |
Demographics Similar to South Americans by Seniors Poverty Over the Age of 75
In terms of seniors poverty over the age of 75, the demographic groups most similar to South Americans are Salvadoran (14.2%, a difference of 0.24%), Armenian (14.2%, a difference of 0.46%), Venezuelan (14.2%, a difference of 0.48%), Colombian (14.3%, a difference of 0.82%), and Immigrants from Venezuela (14.3%, a difference of 0.93%).
| Demographics | Rating | Rank | Seniors Poverty Over the Age of 75 |
| Immigrants | Western Africa | 0.1 /100 | #257 | Tragic 13.9% |
| Immigrants | Panama | 0.1 /100 | #258 | Tragic 13.9% |
| Immigrants | Portugal | 0.1 /100 | #259 | Tragic 13.9% |
| Immigrants | Immigrants | 0.1 /100 | #260 | Tragic 13.9% |
| Ghanaians | 0.1 /100 | #261 | Tragic 14.0% |
| Cajuns | 0.1 /100 | #262 | Tragic 14.0% |
| Iroquois | 0.1 /100 | #263 | Tragic 14.0% |
| South Americans | 0.0 /100 | #264 | Tragic 14.1% |
| Salvadorans | 0.0 /100 | #265 | Tragic 14.2% |
| Armenians | 0.0 /100 | #266 | Tragic 14.2% |
| Venezuelans | 0.0 /100 | #267 | Tragic 14.2% |
| Colombians | 0.0 /100 | #268 | Tragic 14.3% |
| Immigrants | Venezuela | 0.0 /100 | #269 | Tragic 14.3% |
| Immigrants | Uruguay | 0.0 /100 | #270 | Tragic 14.3% |
| Immigrants | Ghana | 0.0 /100 | #271 | Tragic 14.4% |