Immigrants from Eastern Europe vs Romanian Poverty
COMPARE
Immigrants from Eastern Europe
Romanian
Poverty
Poverty Comparison
Immigrants from Eastern Europe
Romanians
11.3%
POVERTY
97.0/ 100
METRIC RATING
75th/ 347
METRIC RANK
11.4%
POVERTY
94.9/ 100
METRIC RATING
93rd/ 347
METRIC RANK
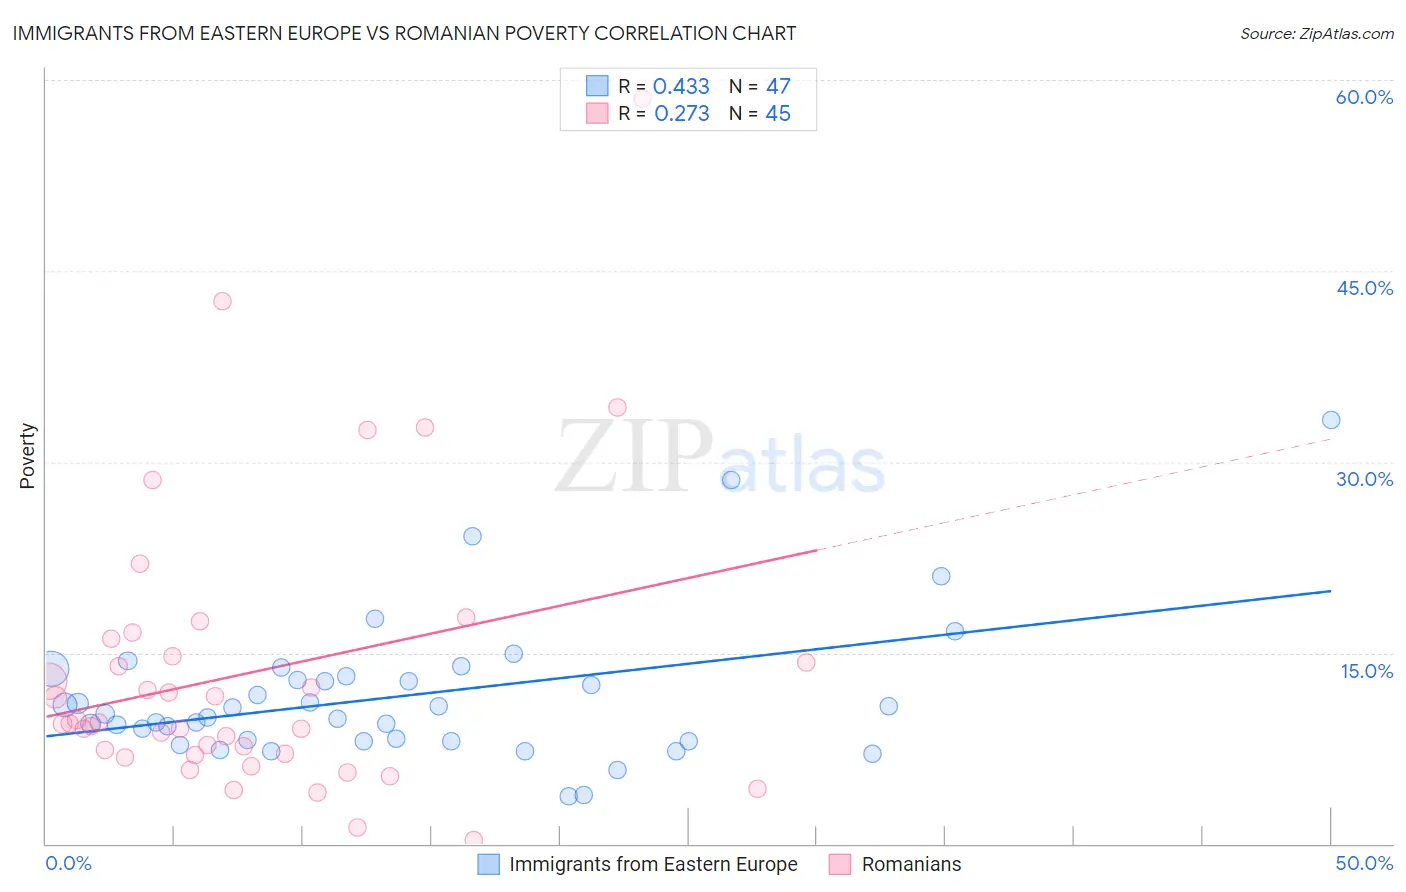
Immigrants from Eastern Europe vs Romanian Poverty Correlation Chart
The statistical analysis conducted on geographies consisting of 475,463,509 people shows a moderate positive correlation between the proportion of Immigrants from Eastern Europe and poverty level in the United States with a correlation coefficient (R) of 0.433 and weighted average of 11.3%. Similarly, the statistical analysis conducted on geographies consisting of 377,713,994 people shows a weak positive correlation between the proportion of Romanians and poverty level in the United States with a correlation coefficient (R) of 0.273 and weighted average of 11.4%, a difference of 1.4%.
Poverty Correlation Summary
| Measurement | Immigrants from Eastern Europe | Romanian |
| Minimum | 3.8% | 0.31% |
| Maximum | 33.3% | 58.5% |
| Range | 29.6% | 58.2% |
| Mean | 11.6% | 13.5% |
| Median | 10.2% | 9.4% |
| Interquartile 25% (IQ1) | 8.1% | 7.0% |
| Interquartile 75% (IQ3) | 13.2% | 15.4% |
| Interquartile Range (IQR) | 5.1% | 8.4% |
| Standard Deviation (Sample) | 5.7% | 11.3% |
| Standard Deviation (Population) | 5.6% | 11.2% |
Demographics Similar to Immigrants from Eastern Europe and Romanians by Poverty
In terms of poverty, the demographic groups most similar to Immigrants from Eastern Europe are Immigrants from North America (11.3%, a difference of 0.15%), Carpatho Rusyn (11.3%, a difference of 0.19%), Immigrants from Eastern Asia (11.3%, a difference of 0.22%), Dutch (11.3%, a difference of 0.24%), and Cambodian (11.3%, a difference of 0.28%). Similarly, the demographic groups most similar to Romanians are Paraguayan (11.4%, a difference of 0.020%), British (11.4%, a difference of 0.030%), Finnish (11.4%, a difference of 0.17%), Immigrants from Denmark (11.4%, a difference of 0.31%), and Czechoslovakian (11.4%, a difference of 0.47%).
| Demographics | Rating | Rank | Poverty |
| Carpatho Rusyns | 97.2 /100 | #74 | Exceptional 11.3% |
| Immigrants | Eastern Europe | 97.0 /100 | #75 | Exceptional 11.3% |
| Immigrants | North America | 96.8 /100 | #76 | Exceptional 11.3% |
| Immigrants | Eastern Asia | 96.7 /100 | #77 | Exceptional 11.3% |
| Dutch | 96.7 /100 | #78 | Exceptional 11.3% |
| Cambodians | 96.7 /100 | #79 | Exceptional 11.3% |
| Indians (Asian) | 96.6 /100 | #80 | Exceptional 11.3% |
| Irish | 96.6 /100 | #81 | Exceptional 11.3% |
| Egyptians | 96.5 /100 | #82 | Exceptional 11.3% |
| Immigrants | Sweden | 96.3 /100 | #83 | Exceptional 11.3% |
| English | 96.3 /100 | #84 | Exceptional 11.3% |
| Immigrants | England | 96.2 /100 | #85 | Exceptional 11.4% |
| Jordanians | 96.0 /100 | #86 | Exceptional 11.4% |
| Northern Europeans | 96.0 /100 | #87 | Exceptional 11.4% |
| Belgians | 95.8 /100 | #88 | Exceptional 11.4% |
| Czechoslovakians | 95.7 /100 | #89 | Exceptional 11.4% |
| Immigrants | Denmark | 95.5 /100 | #90 | Exceptional 11.4% |
| Finns | 95.2 /100 | #91 | Exceptional 11.4% |
| British | 95.0 /100 | #92 | Exceptional 11.4% |
| Romanians | 94.9 /100 | #93 | Exceptional 11.4% |
| Paraguayans | 94.9 /100 | #94 | Exceptional 11.4% |