Immigrants from Eastern Europe vs Immigrants from Syria Poverty
COMPARE
Immigrants from Eastern Europe
Immigrants from Syria
Poverty
Poverty Comparison
Immigrants from Eastern Europe
Immigrants from Syria
11.3%
POVERTY
97.0/ 100
METRIC RATING
75th/ 347
METRIC RANK
12.3%
POVERTY
47.5/ 100
METRIC RATING
177th/ 347
METRIC RANK
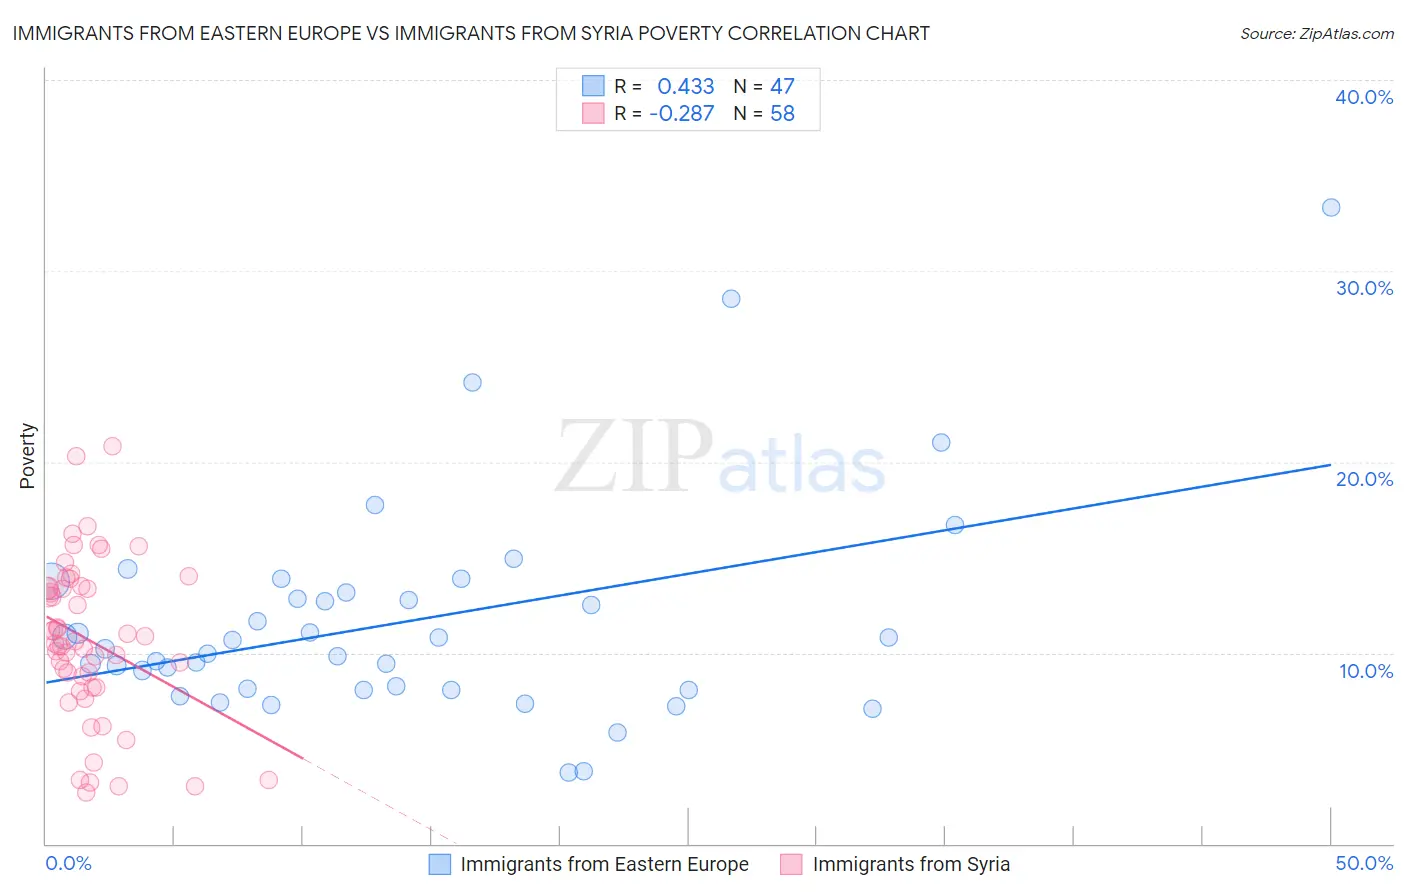
Immigrants from Eastern Europe vs Immigrants from Syria Poverty Correlation Chart
The statistical analysis conducted on geographies consisting of 475,463,509 people shows a moderate positive correlation between the proportion of Immigrants from Eastern Europe and poverty level in the United States with a correlation coefficient (R) of 0.433 and weighted average of 11.3%. Similarly, the statistical analysis conducted on geographies consisting of 173,988,191 people shows a weak negative correlation between the proportion of Immigrants from Syria and poverty level in the United States with a correlation coefficient (R) of -0.286 and weighted average of 12.3%, a difference of 9.5%.
Poverty Correlation Summary
| Measurement | Immigrants from Eastern Europe | Immigrants from Syria |
| Minimum | 3.8% | 2.7% |
| Maximum | 33.3% | 20.8% |
| Range | 29.6% | 18.1% |
| Mean | 11.6% | 10.7% |
| Median | 10.2% | 10.5% |
| Interquartile 25% (IQ1) | 8.1% | 8.2% |
| Interquartile 75% (IQ3) | 13.2% | 13.4% |
| Interquartile Range (IQR) | 5.1% | 5.2% |
| Standard Deviation (Sample) | 5.7% | 4.2% |
| Standard Deviation (Population) | 5.6% | 4.1% |
Similar Demographics by Poverty
Demographics Similar to Immigrants from Eastern Europe by Poverty
In terms of poverty, the demographic groups most similar to Immigrants from Eastern Europe are Immigrants from North America (11.3%, a difference of 0.15%), Carpatho Rusyn (11.3%, a difference of 0.19%), Immigrants from Eastern Asia (11.3%, a difference of 0.22%), European (11.3%, a difference of 0.24%), and Immigrants from Belgium (11.3%, a difference of 0.24%).
| Demographics | Rating | Rank | Poverty |
| Slovaks | 97.4 /100 | #68 | Exceptional 11.2% |
| Serbians | 97.4 /100 | #69 | Exceptional 11.2% |
| Immigrants | Canada | 97.3 /100 | #70 | Exceptional 11.3% |
| Zimbabweans | 97.3 /100 | #71 | Exceptional 11.3% |
| Europeans | 97.2 /100 | #72 | Exceptional 11.3% |
| Immigrants | Belgium | 97.2 /100 | #73 | Exceptional 11.3% |
| Carpatho Rusyns | 97.2 /100 | #74 | Exceptional 11.3% |
| Immigrants | Eastern Europe | 97.0 /100 | #75 | Exceptional 11.3% |
| Immigrants | North America | 96.8 /100 | #76 | Exceptional 11.3% |
| Immigrants | Eastern Asia | 96.7 /100 | #77 | Exceptional 11.3% |
| Dutch | 96.7 /100 | #78 | Exceptional 11.3% |
| Cambodians | 96.7 /100 | #79 | Exceptional 11.3% |
| Indians (Asian) | 96.6 /100 | #80 | Exceptional 11.3% |
| Irish | 96.6 /100 | #81 | Exceptional 11.3% |
| Egyptians | 96.5 /100 | #82 | Exceptional 11.3% |
Demographics Similar to Immigrants from Syria by Poverty
In terms of poverty, the demographic groups most similar to Immigrants from Syria are Immigrants from Colombia (12.3%, a difference of 0.020%), South American (12.3%, a difference of 0.12%), Lebanese (12.3%, a difference of 0.25%), Celtic (12.3%, a difference of 0.26%), and Uruguayan (12.4%, a difference of 0.27%).
| Demographics | Rating | Rank | Poverty |
| Immigrants | Oceania | 54.6 /100 | #170 | Average 12.3% |
| Immigrants | Spain | 51.3 /100 | #171 | Average 12.3% |
| Immigrants | Portugal | 50.5 /100 | #172 | Average 12.3% |
| Celtics | 50.1 /100 | #173 | Average 12.3% |
| Lebanese | 50.0 /100 | #174 | Average 12.3% |
| South Americans | 48.7 /100 | #175 | Average 12.3% |
| Immigrants | Colombia | 47.7 /100 | #176 | Average 12.3% |
| Immigrants | Syria | 47.5 /100 | #177 | Average 12.3% |
| Uruguayans | 44.7 /100 | #178 | Average 12.4% |
| Immigrants | Morocco | 44.0 /100 | #179 | Average 12.4% |
| Mongolians | 43.6 /100 | #180 | Average 12.4% |
| Immigrants | Afghanistan | 42.1 /100 | #181 | Average 12.4% |
| Immigrants | Cameroon | 41.7 /100 | #182 | Average 12.4% |
| Immigrants | Iraq | 40.2 /100 | #183 | Average 12.4% |
| Kenyans | 38.8 /100 | #184 | Fair 12.5% |