Immigrants from Eastern Asia vs Chickasaw Female Poverty Among 18-24 Year Olds

COMPARE

Immigrants from Eastern Asia
Race
Ancestry
AfghanAfricanAlaska NativeAlaskan AthabascanAlbanianAleutAlsatianAmericanApacheArabArapahoArgentineanArmenianAssyrian/Chaldean/SyriacAustralianAustrianBahamianBangladeshiBarbadianBasqueBelgianBelizeanBermudanBhutaneseBlackfeetBolivianBrazilianBritishBritish West IndianBulgarianBurmeseCajunCambodianCanadianCape VerdeanCarpatho RusynCelticCentral AmericanCentral American IndianCherokeeCheyenneChileanChineseChippewaChoctawColombianColvilleComancheCosta RicanCreeCreekCroatianCrowCubanCypriotCzechCzechoslovakianDanishDelawareDominicanDutchDutch West IndianEastern EuropeanEcuadorianEgyptianEnglishEstonianEthiopianEuropeanFijianFilipinoFinnishFrenchFrench American IndianFrench CanadianGermanGerman RussianGhanaianGreekGuamanian/ChamorroGuatemalanGuyaneseHaitianHmongHonduranHopiHoumaHungarianIcelanderIndian (Asian)IndonesianInupiatIranianIraqiIrishIroquoisIsraeliItalianJamaicanJapaneseJordanianKenyanKiowaKoreanLaotianLatvianLebaneseLiberianLithuanianLumbeeLuxembourgerMacedonianMalaysianMalteseMarshalleseMenomineeMexicanMexican American IndianMongolianMoroccanNative HawaiianNavajoNepaleseNew ZealanderNicaraguanNigerianNorthern EuropeanNorwegianOkinawanOsageOttawaPaiutePakistaniPalestinianPanamanianParaguayanPennsylvania GermanPeruvianPimaPolishPortuguesePotawatomiPuebloPuerto RicanPuget Sound SalishRomanianRussianSalvadoranSamoanScandinavianScotch-IrishScottishSeminoleSenegaleseSerbianShoshoneSierra LeoneanSiouxSlavicSlovakSloveneSomaliSouth AfricanSouth AmericanSouth American IndianSoviet UnionSpaniardSpanishSpanish AmericanSpanish American IndianSri LankanSubsaharan AfricanSudaneseSwedishSwissSyrianTaiwaneseThaiTlingit-HaidaTohono O'OdhamTonganTrinidadian and TobagonianTsimshianTurkishU.S. Virgin IslanderUgandanUkrainianUruguayanUteVenezuelanVietnameseWelshWest IndianYakamaYaquiYugoslavianYumanYup'ikZimbabwean
Immigration
NonimmigrantsImmigrantsAfghanistanAfricaAlbaniaArgentinaArmeniaAsiaAustraliaAustriaBahamasBangladeshBarbadosBelarusBelgiumBelizeBoliviaBosnia and HerzegovinaBrazilBulgariaBurma/MyanmarCabo VerdeCambodiaCameroonCanadaCaribbeanCentral AmericaChileChinaColombiaCongoCosta RicaCroatiaCubaCzechoslovakiaDenmarkDominicaDominican RepublicEastern AfricaEastern AsiaEastern EuropeEcuadorEgyptEl SalvadorEnglandEritreaEthiopiaEuropeFijiFranceGermanyGhanaGreeceGrenadaGuatemalaGuyanaHaitiHondurasHong KongHungaryIndiaIndonesiaIranIraqIrelandIsraelItalyJamaicaJapanJordanKazakhstanKenyaKoreaKuwaitLaosLatin AmericaLatviaLebanonLiberiaLithuaniaMalaysiaMexicoMicronesiaMiddle AfricaMoldovaMoroccoNepalNetherlandsNicaraguaNigeriaNorth AmericaNorth MacedoniaNorthern AfricaNorthern EuropeNorwayOceaniaPakistanPanamaPeruPhilippinesPolandPortugalRomaniaRussiaSaudi ArabiaScotlandSenegalSerbiaSierra LeoneSingaporeSomaliaSouth AfricaSouth AmericaSouth Central AsiaSouth Eastern AsiaSouthern EuropeSpainSri LankaSt. Vincent and the GrenadinesSudanSwedenSwitzerlandSyriaTaiwanThailandTrinidad and TobagoTurkeyUgandaUkraineUruguayUzbekistanVenezuelaVietnamWest IndiesWestern AfricaWestern AsiaWestern EuropeYemenZaireZimbabweAzores
Chickasaw
Race
Ancestry
AfghanAfricanAlaska NativeAlaskan AthabascanAlbanianAleutAlsatianAmericanApacheArabArapahoArgentineanArmenianAssyrian/Chaldean/SyriacAustralianAustrianBahamianBangladeshiBarbadianBasqueBelgianBelizeanBermudanBhutaneseBlackfeetBolivianBrazilianBritishBritish West IndianBulgarianBurmeseCajunCambodianCanadianCape VerdeanCarpatho RusynCelticCentral AmericanCentral American IndianCherokeeCheyenneChickasawChileanChineseChippewaChoctawColombianColvilleComancheCosta RicanCreeCreekCroatianCrowCubanCypriotCzechCzechoslovakianDanishDelawareDominicanDutchDutch West IndianEastern EuropeanEcuadorianEgyptianEnglishEstonianEthiopianEuropeanFijianFilipinoFinnishFrenchFrench American IndianFrench CanadianGermanGerman RussianGhanaianGreekGuamanian/ChamorroGuatemalanGuyaneseHaitianHmongHonduranHopiHoumaHungarianIcelanderIndian (Asian)IndonesianInupiatIranianIraqiIrishIroquoisIsraeliItalianJamaicanJapaneseJordanianKenyanKiowaKoreanLaotianLatvianLebaneseLiberianLithuanianLumbeeLuxembourgerMacedonianMalaysianMalteseMarshalleseMenomineeMexicanMexican American IndianMongolianMoroccanNative HawaiianNavajoNepaleseNew ZealanderNicaraguanNigerianNorthern EuropeanNorwegianOkinawanOsageOttawaPaiutePakistaniPalestinianPanamanianParaguayanPennsylvania GermanPeruvianPimaPolishPortuguesePotawatomiPuebloPuerto RicanPuget Sound SalishRomanianRussianSalvadoranSamoanScandinavianScotch-IrishScottishSeminoleSenegaleseSerbianShoshoneSierra LeoneanSiouxSlavicSlovakSloveneSomaliSouth AfricanSouth AmericanSouth American IndianSoviet UnionSpaniardSpanishSpanish AmericanSpanish American IndianSri LankanSubsaharan AfricanSudaneseSwedishSwissSyrianTaiwaneseThaiTlingit-HaidaTohono O'OdhamTonganTrinidadian and TobagonianTsimshianTurkishU.S. Virgin IslanderUgandanUkrainianUruguayanUteVenezuelanVietnameseWelshWest IndianYakamaYaquiYugoslavianYumanYup'ikZimbabwean
Immigration
NonimmigrantsImmigrantsAfghanistanAfricaAlbaniaArgentinaArmeniaAsiaAustraliaAustriaBahamasBangladeshBarbadosBelarusBelgiumBelizeBoliviaBosnia and HerzegovinaBrazilBulgariaBurma/MyanmarCabo VerdeCambodiaCameroonCanadaCaribbeanCentral AmericaChileChinaColombiaCongoCosta RicaCroatiaCubaCzechoslovakiaDenmarkDominicaDominican RepublicEastern AfricaEastern EuropeEcuadorEgyptEl SalvadorEnglandEritreaEthiopiaEuropeFijiFranceGermanyGhanaGreeceGrenadaGuatemalaGuyanaHaitiHondurasHong KongHungaryIndiaIndonesiaIranIraqIrelandIsraelItalyJamaicaJapanJordanKazakhstanKenyaKoreaKuwaitLaosLatin AmericaLatviaLebanonLiberiaLithuaniaMalaysiaMexicoMicronesiaMiddle AfricaMoldovaMoroccoNepalNetherlandsNicaraguaNigeriaNorth AmericaNorth MacedoniaNorthern AfricaNorthern EuropeNorwayOceaniaPakistanPanamaPeruPhilippinesPolandPortugalRomaniaRussiaSaudi ArabiaScotlandSenegalSerbiaSierra LeoneSingaporeSomaliaSouth AfricaSouth AmericaSouth Central AsiaSouth Eastern AsiaSouthern EuropeSpainSri LankaSt. Vincent and the GrenadinesSudanSwedenSwitzerlandSyriaTaiwanThailandTrinidad and TobagoTurkeyUgandaUkraineUruguayUzbekistanVenezuelaVietnamWest IndiesWestern AfricaWestern AsiaWestern EuropeYemenZaireZimbabweAzores
Female Poverty Among 18-24 Year Olds
Income
Poverty
Unemployment
Labor Participation
Family Structure
Vehicle Availability
Education Level
Disability

Female Poverty Among 18-24 Year Olds Comparison

Immigrants from Eastern Asia

Chickasaw

Good
Tragic
19.8%
FEMALE POVERTY AMONG 18-24 YEAR OLDS
79.7/ 100
METRIC RATING
151st/ 347
METRIC RANK
24.5%
FEMALE POVERTY AMONG 18-24 YEAR OLDS
0.0/ 100
METRIC RATING
318th/ 347
METRIC RANK

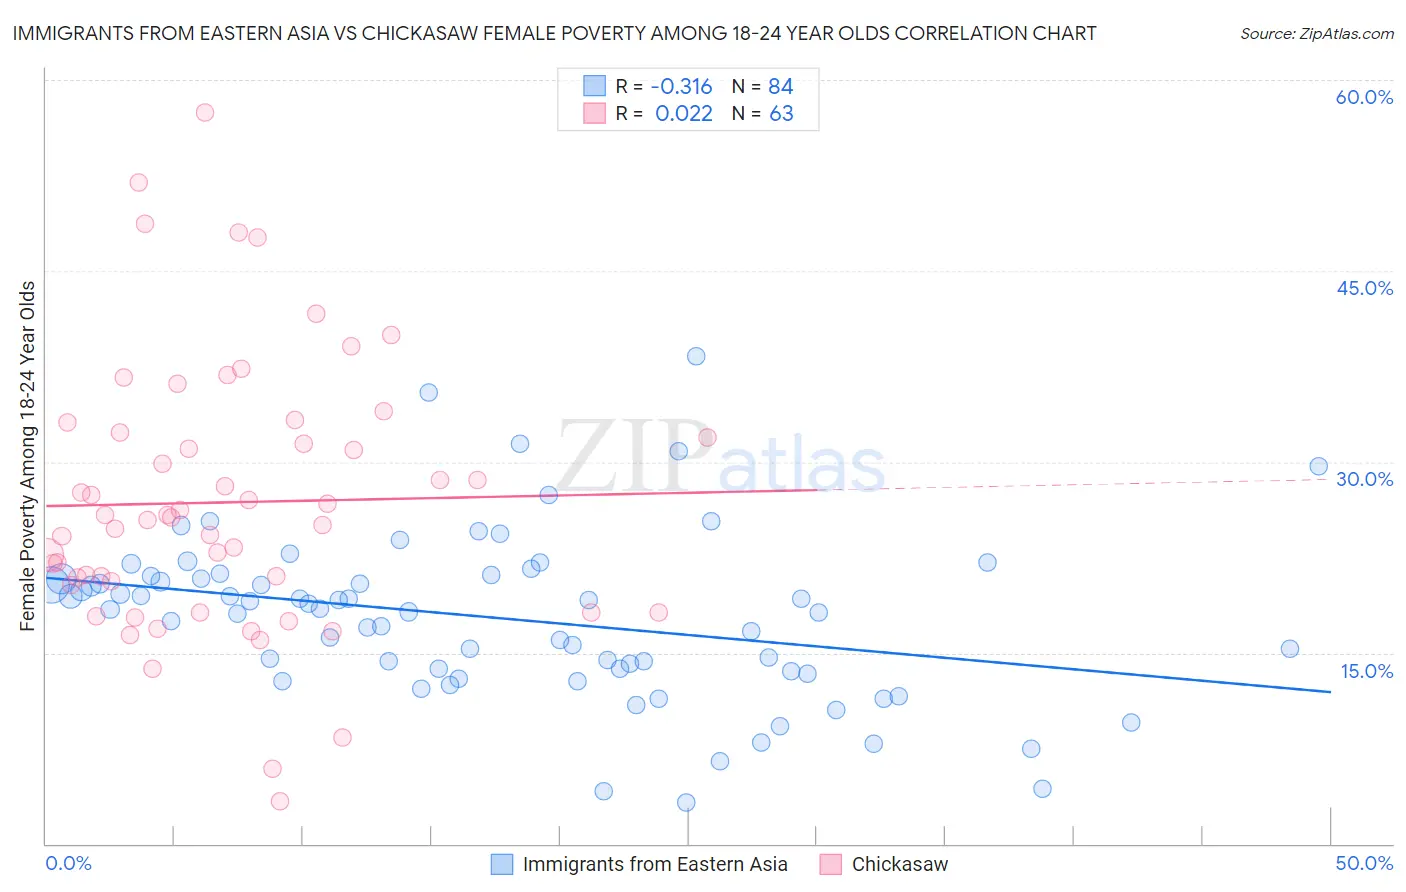
Immigrants from Eastern Asia vs Chickasaw Female Poverty Among 18-24 Year Olds Correlation Chart

The statistical analysis conducted on geographies consisting of 480,513,058 people shows a mild negative correlation between the proportion of Immigrants from Eastern Asia and poverty level among females between the ages 18 and 24 in the United States with a correlation coefficient (R) of -0.316 and weighted average of 19.8%. Similarly, the statistical analysis conducted on geographies consisting of 146,361,358 people shows no correlation between the proportion of Chickasaw and poverty level among females between the ages 18 and 24 in the United States with a correlation coefficient (R) of 0.022 and weighted average of 24.5%, a difference of 23.8%.
Immigrants from Eastern Asia vs Chickasaw Female Poverty Among 18-24 Year Olds

Female Poverty Among 18-24 Year Olds Correlation Summary

MeasurementImmigrants from Eastern AsiaChickasaw
Minimum3.2%3.3%
Maximum38.3%57.4%
Range35.1%54.1%
Mean17.8%26.8%
Median18.4%25.6%
Interquartile 25% (IQ1)13.6%20.4%
Interquartile 75% (IQ3)20.9%32.3%
Interquartile Range (IQR)7.3%12.0%
Standard Deviation (Sample)6.5%10.6%
Standard Deviation (Population)6.5%10.5%

Similar Demographics by Female Poverty Among 18-24 Year Olds

Demographics Similar to Immigrants from Eastern Asia by Female Poverty Among 18-24 Year Olds

In terms of female poverty among 18-24 year olds, the demographic groups most similar to Immigrants from Eastern Asia are Syrian (19.8%, a difference of 0.040%), Yugoslavian (19.8%, a difference of 0.050%), Immigrants from Oceania (19.7%, a difference of 0.12%), Immigrants from Japan (19.8%, a difference of 0.12%), and Immigrants from Latin America (19.7%, a difference of 0.13%).
DemographicsRating | RankFemale Poverty Among 18-24 Year Olds
Immigrants | Northern Africa
84.1
/100
|
#144
Excellent
19.7%
Canadians
83.8
/100
|
#145
Excellent
19.7%
Immigrants | Bosnia and Herzegovina
83.6
/100
|
#146
Excellent
19.7%
Immigrants | Austria
83.1
/100
|
#147
Excellent
19.7%
Immigrants | Latin America
81.3
/100
|
#148
Excellent
19.7%
Immigrants | Oceania
81.2
/100
|
#149
Excellent
19.7%
Syrians
80.2
/100
|
#150
Excellent
19.8%
Immigrants | Eastern Asia
79.7
/100
|
#151
Good
19.8%
Yugoslavians
79.0
/100
|
#152
Good
19.8%
Immigrants | Japan
78.1
/100
|
#153
Good
19.8%
Immigrants | Zimbabwe
76.7
/100
|
#154
Good
19.8%
Hungarians
76.6
/100
|
#155
Good
19.8%
Immigrants | Belgium
76.4
/100
|
#156
Good
19.8%
Danes
75.5
/100
|
#157
Good
19.8%
Immigrants | Lebanon
75.3
/100
|
#158
Good
19.8%

Demographics Similar to Chickasaw by Female Poverty Among 18-24 Year Olds

In terms of female poverty among 18-24 year olds, the demographic groups most similar to Chickasaw are Osage (24.5%, a difference of 0.090%), Dutch West Indian (24.5%, a difference of 0.10%), Alsatian (24.4%, a difference of 0.38%), Immigrants from Congo (24.6%, a difference of 0.40%), and Black/African American (24.3%, a difference of 0.69%).
DemographicsRating | RankFemale Poverty Among 18-24 Year Olds
Potawatomi
0.0
/100
|
#311
Tragic
23.7%
Yuman
0.0
/100
|
#312
Tragic
24.0%
Creek
0.0
/100
|
#313
Tragic
24.2%
Choctaw
0.0
/100
|
#314
Tragic
24.3%
Blacks/African Americans
0.0
/100
|
#315
Tragic
24.3%
Alsatians
0.0
/100
|
#316
Tragic
24.4%
Osage
0.0
/100
|
#317
Tragic
24.5%
Chickasaw
0.0
/100
|
#318
Tragic
24.5%
Dutch West Indians
0.0
/100
|
#319
Tragic
24.5%
Immigrants | Congo
0.0
/100
|
#320
Tragic
24.6%
Immigrants | Zaire
0.0
/100
|
#321
Tragic
25.1%
Somalis
0.0
/100
|
#322
Tragic
25.1%
Arapaho
0.0
/100
|
#323
Tragic
25.2%
German Russians
0.0
/100
|
#324
Tragic
25.2%
Immigrants | Saudi Arabia
0.0
/100
|
#325
Tragic
25.3%