Immigrants from Czechoslovakia vs Immigrants from Southern Europe Poverty

COMPARE

Immigrants from Czechoslovakia
Race
Ancestry
AfghanAfricanAlaska NativeAlaskan AthabascanAlbanianAleutAlsatianAmericanApacheArabArapahoArgentineanArmenianAssyrian/Chaldean/SyriacAustralianAustrianBahamianBangladeshiBarbadianBasqueBelgianBelizeanBermudanBhutaneseBlackfeetBolivianBrazilianBritishBritish West IndianBulgarianBurmeseCajunCambodianCanadianCape VerdeanCarpatho RusynCelticCentral AmericanCentral American IndianCherokeeCheyenneChickasawChileanChineseChippewaChoctawColombianColvilleComancheCosta RicanCreeCreekCroatianCrowCubanCypriotCzechCzechoslovakianDanishDelawareDominicanDutchDutch West IndianEastern EuropeanEcuadorianEgyptianEnglishEstonianEthiopianEuropeanFijianFilipinoFinnishFrenchFrench American IndianFrench CanadianGermanGerman RussianGhanaianGreekGuamanian/ChamorroGuatemalanGuyaneseHaitianHmongHonduranHopiHoumaHungarianIcelanderIndian (Asian)IndonesianInupiatIranianIraqiIrishIroquoisIsraeliItalianJamaicanJapaneseJordanianKenyanKiowaKoreanLaotianLatvianLebaneseLiberianLithuanianLumbeeLuxembourgerMacedonianMalaysianMalteseMarshalleseMenomineeMexicanMexican American IndianMongolianMoroccanNative HawaiianNavajoNepaleseNew ZealanderNicaraguanNigerianNorthern EuropeanNorwegianOkinawanOsageOttawaPaiutePakistaniPalestinianPanamanianParaguayanPennsylvania GermanPeruvianPimaPolishPortuguesePotawatomiPuebloPuerto RicanPuget Sound SalishRomanianRussianSalvadoranSamoanScandinavianScotch-IrishScottishSeminoleSenegaleseSerbianShoshoneSierra LeoneanSiouxSlavicSlovakSloveneSomaliSouth AfricanSouth AmericanSouth American IndianSoviet UnionSpaniardSpanishSpanish AmericanSpanish American IndianSri LankanSubsaharan AfricanSudaneseSwedishSwissSyrianTaiwaneseThaiTlingit-HaidaTohono O'OdhamTonganTrinidadian and TobagonianTsimshianTurkishU.S. Virgin IslanderUgandanUkrainianUruguayanUteVenezuelanVietnameseWelshWest IndianYakamaYaquiYugoslavianYumanYup'ikZimbabwean
Immigration
NonimmigrantsImmigrantsAfghanistanAfricaAlbaniaArgentinaArmeniaAsiaAustraliaAustriaBahamasBangladeshBarbadosBelarusBelgiumBelizeBoliviaBosnia and HerzegovinaBrazilBulgariaBurma/MyanmarCabo VerdeCambodiaCameroonCanadaCaribbeanCentral AmericaChileChinaColombiaCongoCosta RicaCroatiaCubaCzechoslovakiaDenmarkDominicaDominican RepublicEastern AfricaEastern AsiaEastern EuropeEcuadorEgyptEl SalvadorEnglandEritreaEthiopiaEuropeFijiFranceGermanyGhanaGreeceGrenadaGuatemalaGuyanaHaitiHondurasHong KongHungaryIndiaIndonesiaIranIraqIrelandIsraelItalyJamaicaJapanJordanKazakhstanKenyaKoreaKuwaitLaosLatin AmericaLatviaLebanonLiberiaLithuaniaMalaysiaMexicoMicronesiaMiddle AfricaMoldovaMoroccoNepalNetherlandsNicaraguaNigeriaNorth AmericaNorth MacedoniaNorthern AfricaNorthern EuropeNorwayOceaniaPakistanPanamaPeruPhilippinesPolandPortugalRomaniaRussiaSaudi ArabiaScotlandSenegalSerbiaSierra LeoneSingaporeSomaliaSouth AfricaSouth AmericaSouth Central AsiaSouth Eastern AsiaSpainSri LankaSt. Vincent and the GrenadinesSudanSwedenSwitzerlandSyriaTaiwanThailandTrinidad and TobagoTurkeyUgandaUkraineUruguayUzbekistanVenezuelaVietnamWest IndiesWestern AfricaWestern AsiaWestern EuropeYemenZaireZimbabweAzores
Immigrants from Southern Europe
Race
Ancestry
AfghanAfricanAlaska NativeAlaskan AthabascanAlbanianAleutAlsatianAmericanApacheArabArapahoArgentineanArmenianAssyrian/Chaldean/SyriacAustralianAustrianBahamianBangladeshiBarbadianBasqueBelgianBelizeanBermudanBhutaneseBlackfeetBolivianBrazilianBritishBritish West IndianBulgarianBurmeseCajunCambodianCanadianCape VerdeanCarpatho RusynCelticCentral AmericanCentral American IndianCherokeeCheyenneChickasawChileanChineseChippewaChoctawColombianColvilleComancheCosta RicanCreeCreekCroatianCrowCubanCypriotCzechCzechoslovakianDanishDelawareDominicanDutchDutch West IndianEastern EuropeanEcuadorianEgyptianEnglishEstonianEthiopianEuropeanFijianFilipinoFinnishFrenchFrench American IndianFrench CanadianGermanGerman RussianGhanaianGreekGuamanian/ChamorroGuatemalanGuyaneseHaitianHmongHonduranHopiHoumaHungarianIcelanderIndian (Asian)IndonesianInupiatIranianIraqiIrishIroquoisIsraeliItalianJamaicanJapaneseJordanianKenyanKiowaKoreanLaotianLatvianLebaneseLiberianLithuanianLumbeeLuxembourgerMacedonianMalaysianMalteseMarshalleseMenomineeMexicanMexican American IndianMongolianMoroccanNative HawaiianNavajoNepaleseNew ZealanderNicaraguanNigerianNorthern EuropeanNorwegianOkinawanOsageOttawaPaiutePakistaniPalestinianPanamanianParaguayanPennsylvania GermanPeruvianPimaPolishPortuguesePotawatomiPuebloPuerto RicanPuget Sound SalishRomanianRussianSalvadoranSamoanScandinavianScotch-IrishScottishSeminoleSenegaleseSerbianShoshoneSierra LeoneanSiouxSlavicSlovakSloveneSomaliSouth AfricanSouth AmericanSouth American IndianSoviet UnionSpaniardSpanishSpanish AmericanSpanish American IndianSri LankanSubsaharan AfricanSudaneseSwedishSwissSyrianTaiwaneseThaiTlingit-HaidaTohono O'OdhamTonganTrinidadian and TobagonianTsimshianTurkishU.S. Virgin IslanderUgandanUkrainianUruguayanUteVenezuelanVietnameseWelshWest IndianYakamaYaquiYugoslavianYumanYup'ikZimbabwean
Immigration
NonimmigrantsImmigrantsAfghanistanAfricaAlbaniaArgentinaArmeniaAsiaAustraliaAustriaBahamasBangladeshBarbadosBelarusBelgiumBelizeBoliviaBosnia and HerzegovinaBrazilBulgariaBurma/MyanmarCabo VerdeCambodiaCameroonCanadaCaribbeanCentral AmericaChileChinaColombiaCongoCosta RicaCroatiaCubaDenmarkDominicaDominican RepublicEastern AfricaEastern AsiaEastern EuropeEcuadorEgyptEl SalvadorEnglandEritreaEthiopiaEuropeFijiFranceGermanyGhanaGreeceGrenadaGuatemalaGuyanaHaitiHondurasHong KongHungaryIndiaIndonesiaIranIraqIrelandIsraelItalyJamaicaJapanJordanKazakhstanKenyaKoreaKuwaitLaosLatin AmericaLatviaLebanonLiberiaLithuaniaMalaysiaMexicoMicronesiaMiddle AfricaMoldovaMoroccoNepalNetherlandsNicaraguaNigeriaNorth AmericaNorth MacedoniaNorthern AfricaNorthern EuropeNorwayOceaniaPakistanPanamaPeruPhilippinesPolandPortugalRomaniaRussiaSaudi ArabiaScotlandSenegalSerbiaSierra LeoneSingaporeSomaliaSouth AfricaSouth AmericaSouth Central AsiaSouth Eastern AsiaSouthern EuropeSpainSri LankaSt. Vincent and the GrenadinesSudanSwedenSwitzerlandSyriaTaiwanThailandTrinidad and TobagoTurkeyUgandaUkraineUruguayUzbekistanVenezuelaVietnamWest IndiesWestern AfricaWestern AsiaWestern EuropeYemenZaireZimbabweAzores
Poverty
Income
Poverty
Unemployment
Labor Participation
Family Structure
Vehicle Availability
Education Level
Disability

Poverty Comparison

Immigrants from Czechoslovakia

Immigrants from Southern Europe

Exceptional
Exceptional
11.0%
POVERTY
98.9/ 100
METRIC RATING
46th/ 347
METRIC RANK
11.6%
POVERTY
90.8/ 100
METRIC RATING
112th/ 347
METRIC RANK

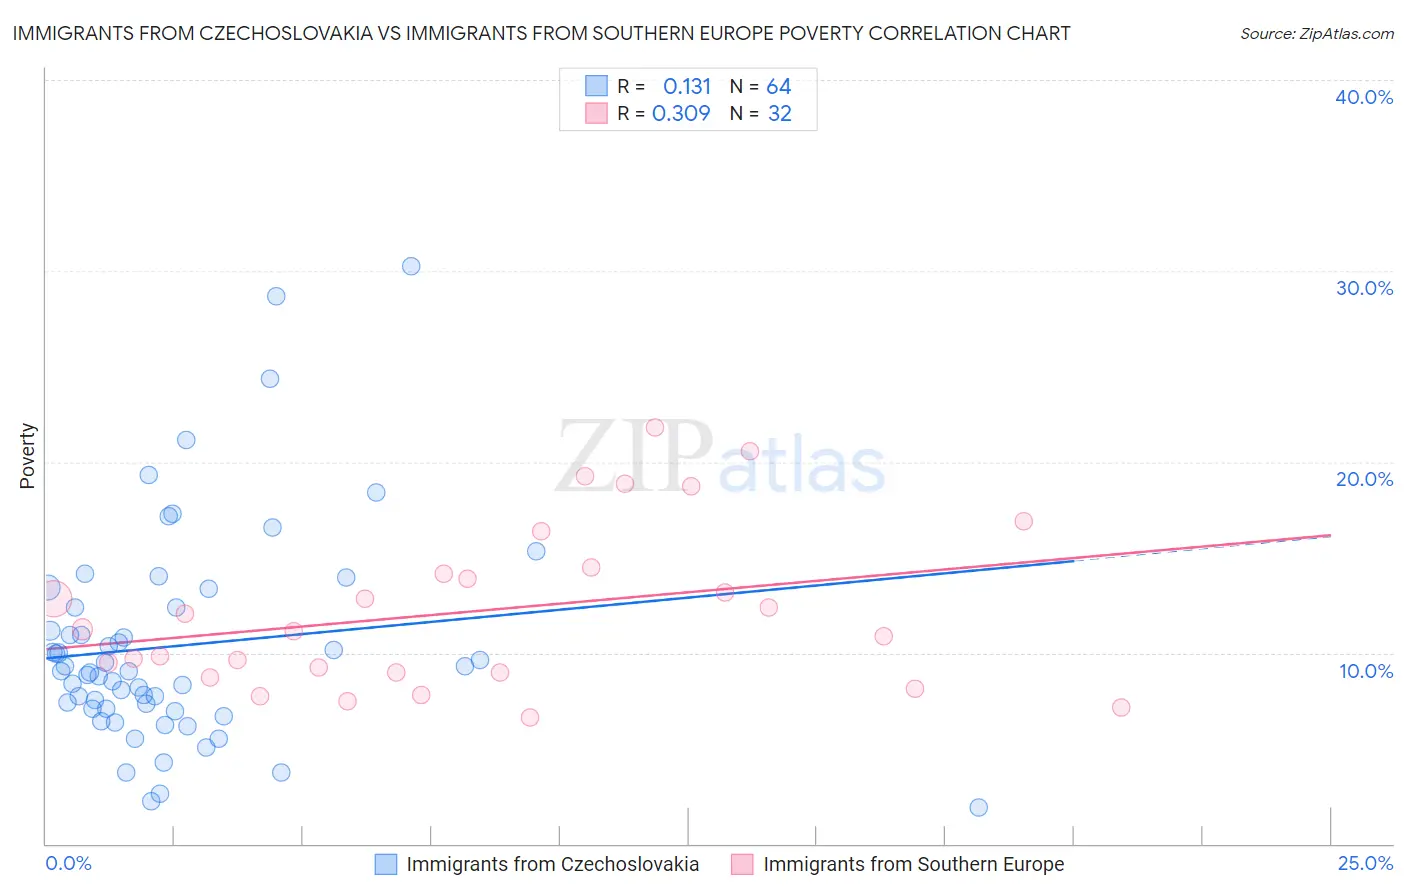
Immigrants from Czechoslovakia vs Immigrants from Southern Europe Poverty Correlation Chart

The statistical analysis conducted on geographies consisting of 195,452,968 people shows a poor positive correlation between the proportion of Immigrants from Czechoslovakia and poverty level in the United States with a correlation coefficient (R) of 0.131 and weighted average of 11.0%. Similarly, the statistical analysis conducted on geographies consisting of 402,613,085 people shows a mild positive correlation between the proportion of Immigrants from Southern Europe and poverty level in the United States with a correlation coefficient (R) of 0.309 and weighted average of 11.6%, a difference of 6.0%.
Immigrants from Czechoslovakia vs Immigrants from Southern Europe Poverty

Poverty Correlation Summary

MeasurementImmigrants from CzechoslovakiaImmigrants from Southern Europe
Minimum1.9%6.6%
Maximum30.2%21.8%
Range28.3%15.2%
Mean10.4%12.2%
Median9.1%11.2%
Interquartile 25% (IQ1)7.1%9.0%
Interquartile 75% (IQ3)12.4%14.3%
Interquartile Range (IQR)5.3%5.3%
Standard Deviation (Sample)5.6%4.3%
Standard Deviation (Population)5.6%4.2%

Similar Demographics by Poverty

Demographics Similar to Immigrants from Czechoslovakia by Poverty

In terms of poverty, the demographic groups most similar to Immigrants from Czechoslovakia are Immigrants from Romania (11.0%, a difference of 0.010%), Slovene (11.0%, a difference of 0.060%), Immigrants from Japan (11.0%, a difference of 0.070%), Turkish (11.0%, a difference of 0.080%), and Asian (11.0%, a difference of 0.10%).
DemographicsRating | RankPoverty
Immigrants | Pakistan
99.3
/100
|
#39
Exceptional
10.8%
Russians
99.3
/100
|
#40
Exceptional
10.9%
Immigrants | Iran
99.2
/100
|
#41
Exceptional
10.9%
Koreans
99.2
/100
|
#42
Exceptional
10.9%
Immigrants | Singapore
99.2
/100
|
#43
Exceptional
10.9%
Immigrants | Moldova
99.1
/100
|
#44
Exceptional
10.9%
Turks
98.9
/100
|
#45
Exceptional
11.0%
Immigrants | Czechoslovakia
98.9
/100
|
#46
Exceptional
11.0%
Immigrants | Romania
98.9
/100
|
#47
Exceptional
11.0%
Slovenes
98.9
/100
|
#48
Exceptional
11.0%
Immigrants | Japan
98.9
/100
|
#49
Exceptional
11.0%
Asians
98.9
/100
|
#50
Exceptional
11.0%
Immigrants | Croatia
98.7
/100
|
#51
Exceptional
11.0%
Immigrants | Philippines
98.7
/100
|
#52
Exceptional
11.0%
Immigrants | Austria
98.6
/100
|
#53
Exceptional
11.1%

Demographics Similar to Immigrants from Southern Europe by Poverty

In terms of poverty, the demographic groups most similar to Immigrants from Southern Europe are Immigrants from Belarus (11.6%, a difference of 0.0%), Immigrants from China (11.6%, a difference of 0.020%), French Canadian (11.6%, a difference of 0.070%), Albanian (11.7%, a difference of 0.16%), and Welsh (11.6%, a difference of 0.23%).
DemographicsRating | RankPoverty
Portuguese
92.1
/100
|
#105
Exceptional
11.6%
Immigrants | Zimbabwe
92.1
/100
|
#106
Exceptional
11.6%
Palestinians
91.8
/100
|
#107
Exceptional
11.6%
Canadians
91.7
/100
|
#108
Exceptional
11.6%
Immigrants | Turkey
91.7
/100
|
#109
Exceptional
11.6%
Welsh
91.6
/100
|
#110
Exceptional
11.6%
French Canadians
91.0
/100
|
#111
Exceptional
11.6%
Immigrants | Southern Europe
90.8
/100
|
#112
Exceptional
11.6%
Immigrants | Belarus
90.8
/100
|
#113
Exceptional
11.6%
Immigrants | China
90.7
/100
|
#114
Exceptional
11.6%
Albanians
90.3
/100
|
#115
Exceptional
11.7%
Immigrants | Russia
89.7
/100
|
#116
Excellent
11.7%
Sri Lankans
89.4
/100
|
#117
Excellent
11.7%
Argentineans
89.1
/100
|
#118
Excellent
11.7%
Tlingit-Haida
89.0
/100
|
#119
Excellent
11.7%