Immigrants from Croatia vs Palestinian Child Poverty Under the Age of 16
COMPARE
Immigrants from Croatia
Palestinian
Child Poverty Under the Age of 16
Child Poverty Under the Age of 16 Comparison
Immigrants from Croatia
Palestinians
14.6%
CHILD POVERTY UNDER THE AGE OF 16
96.1/ 100
METRIC RATING
95th/ 347
METRIC RANK
15.1%
CHILD POVERTY UNDER THE AGE OF 16
90.9/ 100
METRIC RATING
125th/ 347
METRIC RANK
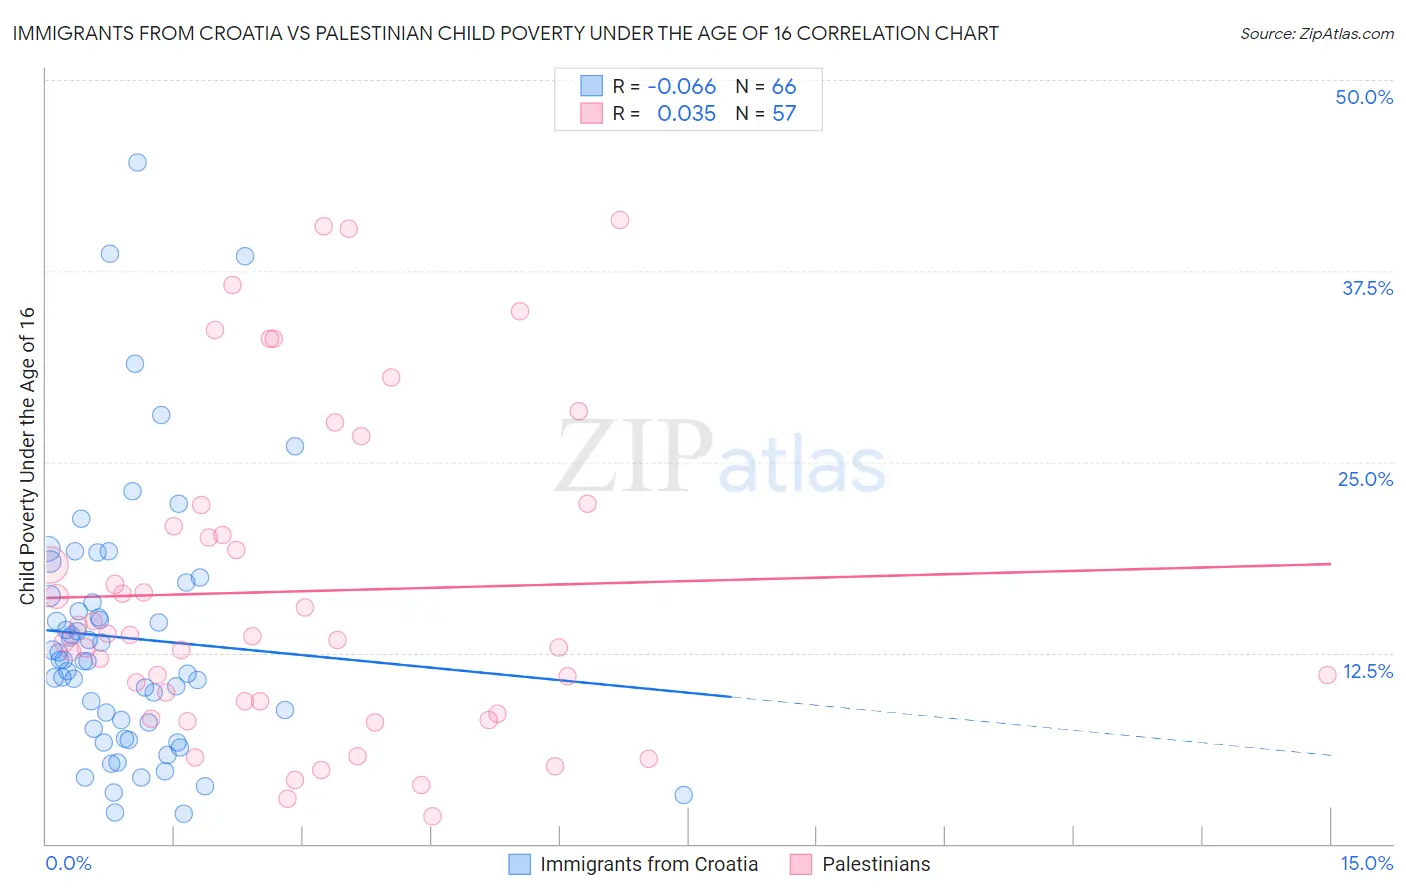
Immigrants from Croatia vs Palestinian Child Poverty Under the Age of 16 Correlation Chart
The statistical analysis conducted on geographies consisting of 131,996,138 people shows a slight negative correlation between the proportion of Immigrants from Croatia and poverty level among children under the age of 16 in the United States with a correlation coefficient (R) of -0.066 and weighted average of 14.6%. Similarly, the statistical analysis conducted on geographies consisting of 215,678,574 people shows no correlation between the proportion of Palestinians and poverty level among children under the age of 16 in the United States with a correlation coefficient (R) of 0.035 and weighted average of 15.1%, a difference of 3.0%.
Child Poverty Under the Age of 16 Correlation Summary
| Measurement | Immigrants from Croatia | Palestinian |
| Minimum | 2.0% | 1.8% |
| Maximum | 44.6% | 40.9% |
| Range | 42.7% | 39.1% |
| Mean | 13.5% | 16.5% |
| Median | 12.0% | 13.6% |
| Interquartile 25% (IQ1) | 7.5% | 8.9% |
| Interquartile 75% (IQ3) | 16.2% | 21.5% |
| Interquartile Range (IQR) | 8.7% | 12.5% |
| Standard Deviation (Sample) | 8.6% | 10.4% |
| Standard Deviation (Population) | 8.6% | 10.3% |
Similar Demographics by Child Poverty Under the Age of 16
Demographics Similar to Immigrants from Croatia by Child Poverty Under the Age of 16
In terms of child poverty under the age of 16, the demographic groups most similar to Immigrants from Croatia are Immigrants from South Africa (14.6%, a difference of 0.17%), Immigrants from France (14.7%, a difference of 0.25%), Paraguayan (14.7%, a difference of 0.36%), Immigrants from Belarus (14.7%, a difference of 0.37%), and Argentinean (14.6%, a difference of 0.44%).
| Demographics | Rating | Rank | Child Poverty Under the Age of 16 |
| Northern Europeans | 97.0 /100 | #88 | Exceptional 14.5% |
| Germans | 96.9 /100 | #89 | Exceptional 14.5% |
| Austrians | 96.9 /100 | #90 | Exceptional 14.5% |
| Immigrants | North America | 96.7 /100 | #91 | Exceptional 14.6% |
| Immigrants | Italy | 96.7 /100 | #92 | Exceptional 14.6% |
| Argentineans | 96.6 /100 | #93 | Exceptional 14.6% |
| Immigrants | South Africa | 96.3 /100 | #94 | Exceptional 14.6% |
| Immigrants | Croatia | 96.1 /100 | #95 | Exceptional 14.6% |
| Immigrants | France | 95.8 /100 | #96 | Exceptional 14.7% |
| Paraguayans | 95.7 /100 | #97 | Exceptional 14.7% |
| Immigrants | Belarus | 95.7 /100 | #98 | Exceptional 14.7% |
| British | 95.5 /100 | #99 | Exceptional 14.7% |
| Dutch | 95.1 /100 | #100 | Exceptional 14.8% |
| Immigrants | Switzerland | 95.1 /100 | #101 | Exceptional 14.8% |
| Romanians | 95.0 /100 | #102 | Exceptional 14.8% |
Demographics Similar to Palestinians by Child Poverty Under the Age of 16
In terms of child poverty under the age of 16, the demographic groups most similar to Palestinians are Immigrants from Brazil (15.1%, a difference of 0.040%), Czechoslovakian (15.1%, a difference of 0.040%), Portuguese (15.1%, a difference of 0.14%), Immigrants from Western Europe (15.1%, a difference of 0.23%), and Pakistani (15.0%, a difference of 0.29%).
| Demographics | Rating | Rank | Child Poverty Under the Age of 16 |
| Immigrants | Malaysia | 92.6 /100 | #118 | Exceptional 15.0% |
| Scottish | 92.3 /100 | #119 | Exceptional 15.0% |
| South Africans | 92.1 /100 | #120 | Exceptional 15.0% |
| Immigrants | Zimbabwe | 92.1 /100 | #121 | Exceptional 15.0% |
| Pakistanis | 91.7 /100 | #122 | Exceptional 15.0% |
| Immigrants | Brazil | 91.1 /100 | #123 | Exceptional 15.1% |
| Czechoslovakians | 91.0 /100 | #124 | Exceptional 15.1% |
| Palestinians | 90.9 /100 | #125 | Exceptional 15.1% |
| Portuguese | 90.6 /100 | #126 | Exceptional 15.1% |
| Immigrants | Western Europe | 90.3 /100 | #127 | Exceptional 15.1% |
| Immigrants | Kazakhstan | 90.2 /100 | #128 | Exceptional 15.1% |
| Immigrants | Southern Europe | 89.7 /100 | #129 | Excellent 15.1% |
| Mongolians | 89.5 /100 | #130 | Excellent 15.2% |
| Armenians | 89.4 /100 | #131 | Excellent 15.2% |
| Canadians | 89.1 /100 | #132 | Excellent 15.2% |