Immigrants from China vs Iranian Child Poverty Under the Age of 16
COMPARE
Immigrants from China
Iranian
Child Poverty Under the Age of 16
Child Poverty Under the Age of 16 Comparison
Immigrants from China
Iranians
13.3%
CHILD POVERTY UNDER THE AGE OF 16
99.8/ 100
METRIC RATING
27th/ 347
METRIC RANK
12.2%
CHILD POVERTY UNDER THE AGE OF 16
100.0/ 100
METRIC RATING
7th/ 347
METRIC RANK
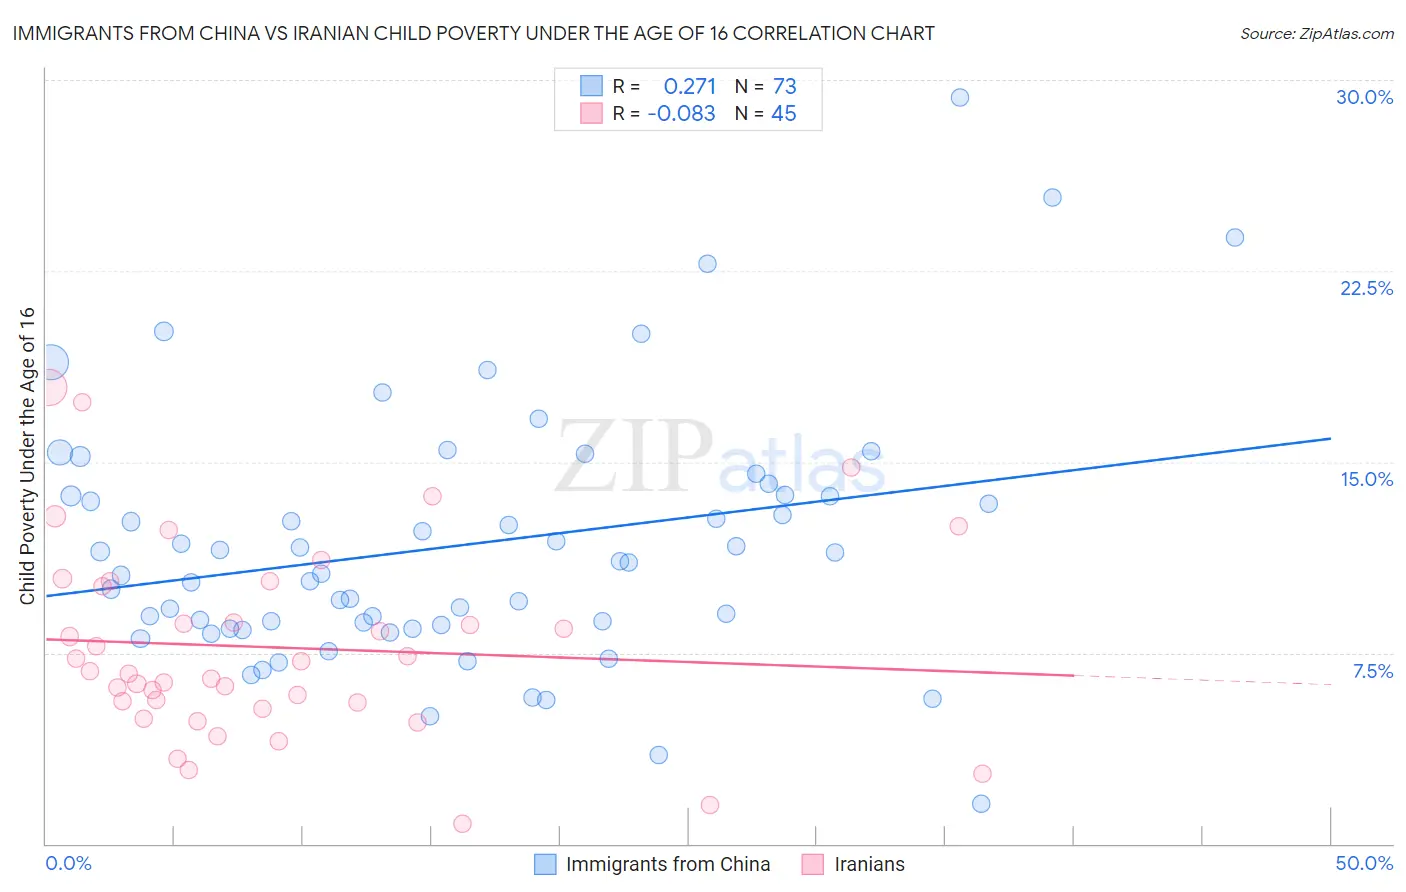
Immigrants from China vs Iranian Child Poverty Under the Age of 16 Correlation Chart
The statistical analysis conducted on geographies consisting of 450,826,325 people shows a weak positive correlation between the proportion of Immigrants from China and poverty level among children under the age of 16 in the United States with a correlation coefficient (R) of 0.271 and weighted average of 13.3%. Similarly, the statistical analysis conducted on geographies consisting of 314,255,547 people shows a slight negative correlation between the proportion of Iranians and poverty level among children under the age of 16 in the United States with a correlation coefficient (R) of -0.083 and weighted average of 12.2%, a difference of 8.5%.
Child Poverty Under the Age of 16 Correlation Summary
| Measurement | Immigrants from China | Iranian |
| Minimum | 1.6% | 0.81% |
| Maximum | 29.3% | 17.9% |
| Range | 27.7% | 17.1% |
| Mean | 11.7% | 7.7% |
| Median | 11.0% | 6.8% |
| Interquartile 25% (IQ1) | 8.5% | 5.4% |
| Interquartile 75% (IQ3) | 13.7% | 10.2% |
| Interquartile Range (IQR) | 5.2% | 4.8% |
| Standard Deviation (Sample) | 5.0% | 3.8% |
| Standard Deviation (Population) | 5.0% | 3.8% |
Demographics Similar to Immigrants from China and Iranians by Child Poverty Under the Age of 16
In terms of child poverty under the age of 16, the demographic groups most similar to Immigrants from China are Bolivian (13.2%, a difference of 0.29%), Eastern European (13.2%, a difference of 0.71%), Latvian (13.2%, a difference of 0.79%), Indian (Asian) (13.1%, a difference of 1.0%), and Maltese (13.1%, a difference of 1.0%). Similarly, the demographic groups most similar to Iranians are Immigrants from Singapore (12.4%, a difference of 1.1%), Immigrants from Iran (12.4%, a difference of 1.2%), Immigrants from South Central Asia (12.5%, a difference of 2.4%), Bhutanese (12.5%, a difference of 2.4%), and Immigrants from Ireland (12.7%, a difference of 3.6%).
| Demographics | Rating | Rank | Child Poverty Under the Age of 16 |
| Iranians | 100.0 /100 | #7 | Exceptional 12.2% |
| Immigrants | Singapore | 100.0 /100 | #8 | Exceptional 12.4% |
| Immigrants | Iran | 100.0 /100 | #9 | Exceptional 12.4% |
| Immigrants | South Central Asia | 99.9 /100 | #10 | Exceptional 12.5% |
| Bhutanese | 99.9 /100 | #11 | Exceptional 12.5% |
| Immigrants | Ireland | 99.9 /100 | #12 | Exceptional 12.7% |
| Burmese | 99.9 /100 | #13 | Exceptional 12.8% |
| Immigrants | Lithuania | 99.9 /100 | #14 | Exceptional 12.9% |
| Immigrants | Korea | 99.9 /100 | #15 | Exceptional 13.0% |
| Norwegians | 99.9 /100 | #16 | Exceptional 13.0% |
| Bulgarians | 99.9 /100 | #17 | Exceptional 13.0% |
| Cypriots | 99.9 /100 | #18 | Exceptional 13.0% |
| Immigrants | Japan | 99.8 /100 | #19 | Exceptional 13.0% |
| Okinawans | 99.8 /100 | #20 | Exceptional 13.1% |
| Immigrants | Eastern Asia | 99.8 /100 | #21 | Exceptional 13.1% |
| Maltese | 99.8 /100 | #22 | Exceptional 13.1% |
| Indians (Asian) | 99.8 /100 | #23 | Exceptional 13.1% |
| Latvians | 99.8 /100 | #24 | Exceptional 13.2% |
| Eastern Europeans | 99.8 /100 | #25 | Exceptional 13.2% |
| Bolivians | 99.8 /100 | #26 | Exceptional 13.2% |
| Immigrants | China | 99.8 /100 | #27 | Exceptional 13.3% |