Immigrants from Chile vs Mongolian Female Poverty Among 25-34 Year Olds
COMPARE
Immigrants from Chile
Mongolian
Female Poverty Among 25-34 Year Olds
Female Poverty Among 25-34 Year Olds Comparison
Immigrants from Chile
Mongolians
13.1%
FEMALE POVERTY AMONG 25-34 YEAR OLDS
84.6/ 100
METRIC RATING
137th/ 347
METRIC RANK
12.8%
FEMALE POVERTY AMONG 25-34 YEAR OLDS
93.0/ 100
METRIC RATING
118th/ 347
METRIC RANK
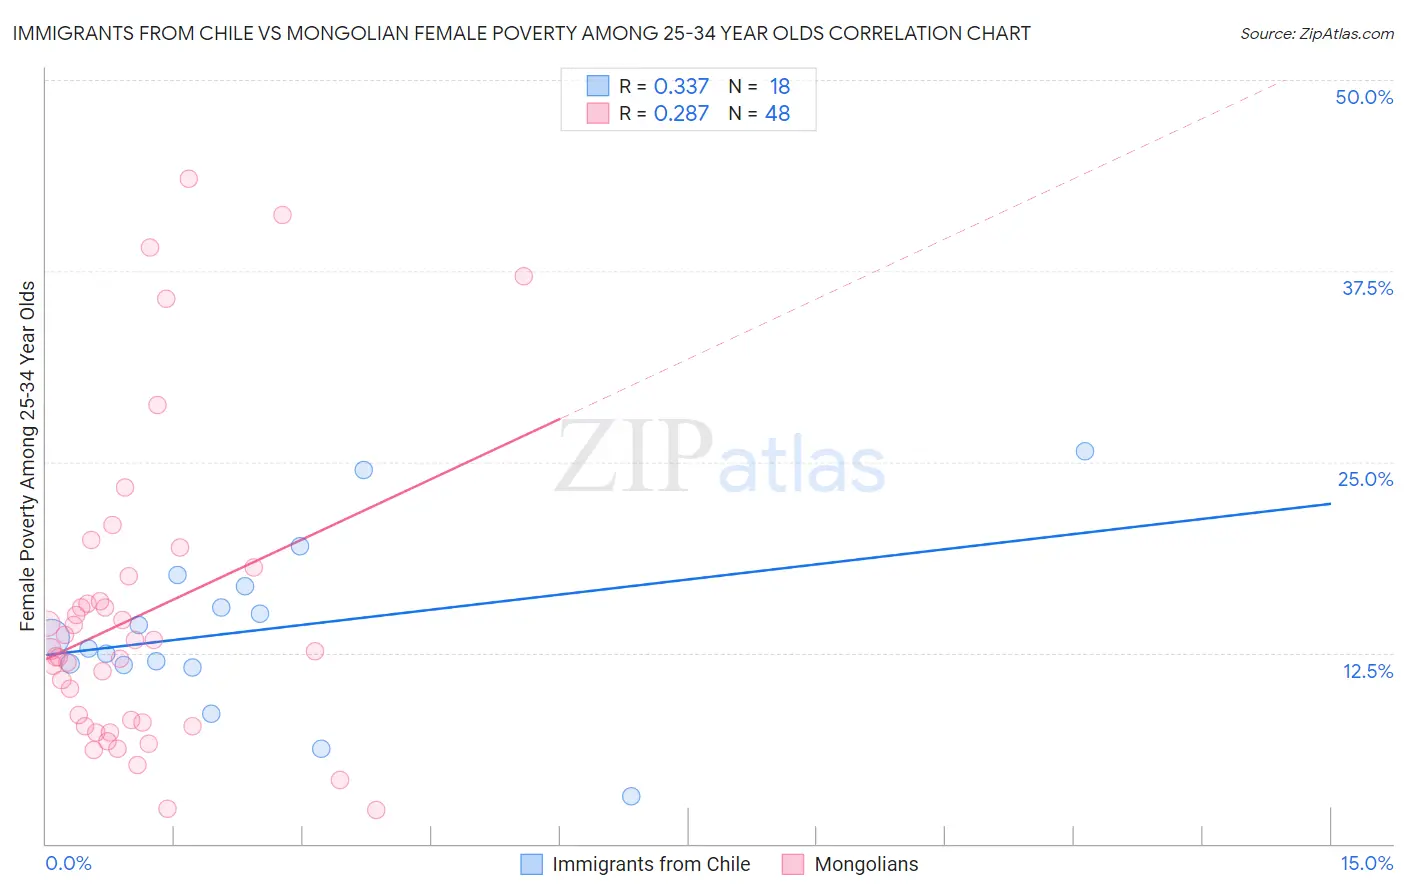
Immigrants from Chile vs Mongolian Female Poverty Among 25-34 Year Olds Correlation Chart
The statistical analysis conducted on geographies consisting of 216,631,317 people shows a mild positive correlation between the proportion of Immigrants from Chile and poverty level among females between the ages 25 and 34 in the United States with a correlation coefficient (R) of 0.337 and weighted average of 13.1%. Similarly, the statistical analysis conducted on geographies consisting of 139,569,877 people shows a weak positive correlation between the proportion of Mongolians and poverty level among females between the ages 25 and 34 in the United States with a correlation coefficient (R) of 0.287 and weighted average of 12.8%, a difference of 1.9%.
Female Poverty Among 25-34 Year Olds Correlation Summary
| Measurement | Immigrants from Chile | Mongolian |
| Minimum | 3.1% | 2.2% |
| Maximum | 25.7% | 43.5% |
| Range | 22.6% | 41.3% |
| Mean | 14.0% | 14.9% |
| Median | 13.2% | 12.7% |
| Interquartile 25% (IQ1) | 11.7% | 7.8% |
| Interquartile 75% (IQ3) | 16.9% | 16.7% |
| Interquartile Range (IQR) | 5.2% | 8.9% |
| Standard Deviation (Sample) | 5.6% | 10.0% |
| Standard Deviation (Population) | 5.5% | 9.9% |
Demographics Similar to Immigrants from Chile and Mongolians by Female Poverty Among 25-34 Year Olds
In terms of female poverty among 25-34 year olds, the demographic groups most similar to Immigrants from Chile are Immigrants from England (13.0%, a difference of 0.16%), South African (13.0%, a difference of 0.18%), Afghan (13.0%, a difference of 0.20%), Serbian (13.0%, a difference of 0.55%), and Immigrants from Hungary (13.0%, a difference of 0.69%). Similarly, the demographic groups most similar to Mongolians are Immigrants from Kuwait (12.8%, a difference of 0.010%), Immigrants from Nepal (12.8%, a difference of 0.010%), Carpatho Rusyn (12.8%, a difference of 0.010%), Romanian (12.8%, a difference of 0.080%), and Immigrants from Western Asia (12.8%, a difference of 0.10%).
| Demographics | Rating | Rank | Female Poverty Among 25-34 Year Olds |
| Immigrants | Kuwait | 93.1 /100 | #117 | Exceptional 12.8% |
| Mongolians | 93.0 /100 | #118 | Exceptional 12.8% |
| Immigrants | Nepal | 93.0 /100 | #119 | Exceptional 12.8% |
| Carpatho Rusyns | 93.0 /100 | #120 | Exceptional 12.8% |
| Romanians | 92.8 /100 | #121 | Exceptional 12.8% |
| Immigrants | Western Asia | 92.7 /100 | #122 | Exceptional 12.8% |
| Slovenes | 92.7 /100 | #123 | Exceptional 12.8% |
| Immigrants | Netherlands | 92.0 /100 | #124 | Exceptional 12.8% |
| Immigrants | Canada | 91.5 /100 | #125 | Exceptional 12.9% |
| Immigrants | Fiji | 91.2 /100 | #126 | Exceptional 12.9% |
| Czechs | 90.3 /100 | #127 | Exceptional 12.9% |
| Syrians | 90.2 /100 | #128 | Exceptional 12.9% |
| Immigrants | North America | 89.7 /100 | #129 | Excellent 12.9% |
| Immigrants | Uzbekistan | 89.6 /100 | #130 | Excellent 12.9% |
| Pakistanis | 88.4 /100 | #131 | Excellent 13.0% |
| Immigrants | Hungary | 88.3 /100 | #132 | Excellent 13.0% |
| Serbians | 87.6 /100 | #133 | Excellent 13.0% |
| Afghans | 85.8 /100 | #134 | Excellent 13.0% |
| South Africans | 85.7 /100 | #135 | Excellent 13.0% |
| Immigrants | England | 85.5 /100 | #136 | Excellent 13.0% |
| Immigrants | Chile | 84.6 /100 | #137 | Excellent 13.1% |