Immigrants from Chile vs Immigrants from Turkey Female Poverty Among 25-34 Year Olds
COMPARE
Immigrants from Chile
Immigrants from Turkey
Female Poverty Among 25-34 Year Olds
Female Poverty Among 25-34 Year Olds Comparison
Immigrants from Chile
Immigrants from Turkey
13.1%
FEMALE POVERTY AMONG 25-34 YEAR OLDS
84.6/ 100
METRIC RATING
137th/ 347
METRIC RANK
11.9%
FEMALE POVERTY AMONG 25-34 YEAR OLDS
99.7/ 100
METRIC RATING
42nd/ 347
METRIC RANK
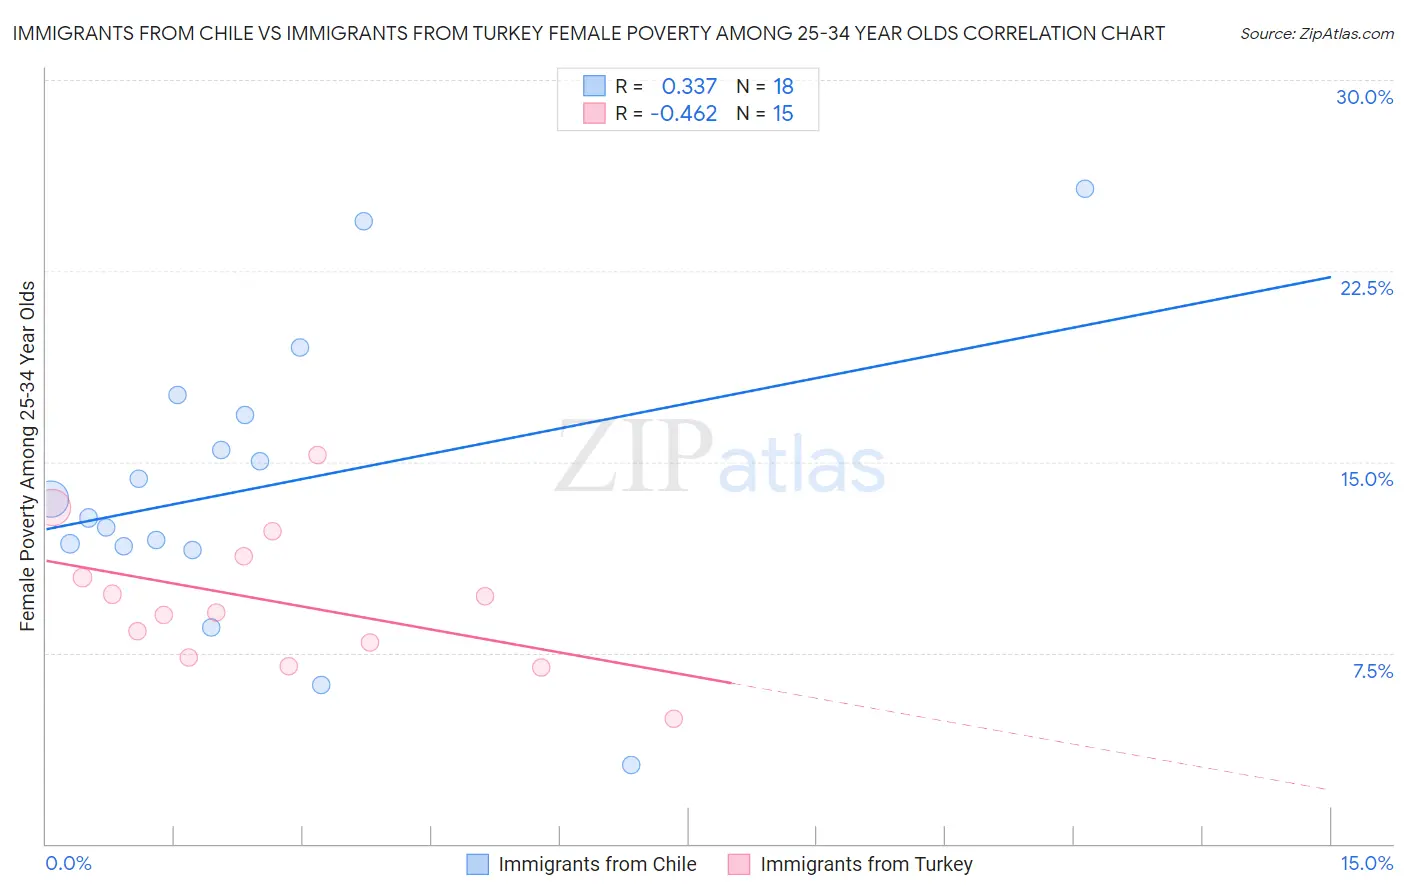
Immigrants from Chile vs Immigrants from Turkey Female Poverty Among 25-34 Year Olds Correlation Chart
The statistical analysis conducted on geographies consisting of 216,631,317 people shows a mild positive correlation between the proportion of Immigrants from Chile and poverty level among females between the ages 25 and 34 in the United States with a correlation coefficient (R) of 0.337 and weighted average of 13.1%. Similarly, the statistical analysis conducted on geographies consisting of 220,548,075 people shows a moderate negative correlation between the proportion of Immigrants from Turkey and poverty level among females between the ages 25 and 34 in the United States with a correlation coefficient (R) of -0.462 and weighted average of 11.9%, a difference of 9.9%.
Female Poverty Among 25-34 Year Olds Correlation Summary
| Measurement | Immigrants from Chile | Immigrants from Turkey |
| Minimum | 3.1% | 4.9% |
| Maximum | 25.7% | 15.3% |
| Range | 22.6% | 10.3% |
| Mean | 14.0% | 9.5% |
| Median | 13.2% | 9.1% |
| Interquartile 25% (IQ1) | 11.7% | 7.3% |
| Interquartile 75% (IQ3) | 16.9% | 11.3% |
| Interquartile Range (IQR) | 5.2% | 4.0% |
| Standard Deviation (Sample) | 5.6% | 2.7% |
| Standard Deviation (Population) | 5.5% | 2.6% |
Similar Demographics by Female Poverty Among 25-34 Year Olds
Demographics Similar to Immigrants from Chile by Female Poverty Among 25-34 Year Olds
In terms of female poverty among 25-34 year olds, the demographic groups most similar to Immigrants from Chile are Brazilian (13.1%, a difference of 0.010%), Austrian (13.1%, a difference of 0.14%), Immigrants from England (13.0%, a difference of 0.16%), Immigrants from Iraq (13.1%, a difference of 0.16%), and South African (13.0%, a difference of 0.18%).
| Demographics | Rating | Rank | Female Poverty Among 25-34 Year Olds |
| Immigrants | Uzbekistan | 89.6 /100 | #130 | Excellent 12.9% |
| Pakistanis | 88.4 /100 | #131 | Excellent 13.0% |
| Immigrants | Hungary | 88.3 /100 | #132 | Excellent 13.0% |
| Serbians | 87.6 /100 | #133 | Excellent 13.0% |
| Afghans | 85.8 /100 | #134 | Excellent 13.0% |
| South Africans | 85.7 /100 | #135 | Excellent 13.0% |
| Immigrants | England | 85.5 /100 | #136 | Excellent 13.0% |
| Immigrants | Chile | 84.6 /100 | #137 | Excellent 13.1% |
| Brazilians | 84.5 /100 | #138 | Excellent 13.1% |
| Austrians | 83.7 /100 | #139 | Excellent 13.1% |
| Immigrants | Iraq | 83.6 /100 | #140 | Excellent 13.1% |
| New Zealanders | 83.4 /100 | #141 | Excellent 13.1% |
| Scandinavians | 82.3 /100 | #142 | Excellent 13.1% |
| Israelis | 81.9 /100 | #143 | Excellent 13.1% |
| Native Hawaiians | 78.9 /100 | #144 | Good 13.2% |
Demographics Similar to Immigrants from Turkey by Female Poverty Among 25-34 Year Olds
In terms of female poverty among 25-34 year olds, the demographic groups most similar to Immigrants from Turkey are Egyptian (11.9%, a difference of 0.25%), Immigrants from Australia (11.9%, a difference of 0.26%), Immigrants from Indonesia (11.8%, a difference of 0.30%), Immigrants from Bulgaria (11.8%, a difference of 0.42%), and Macedonian (11.9%, a difference of 0.53%).
| Demographics | Rating | Rank | Female Poverty Among 25-34 Year Olds |
| Cambodians | 99.9 /100 | #35 | Exceptional 11.7% |
| Immigrants | Sri Lanka | 99.8 /100 | #36 | Exceptional 11.8% |
| Taiwanese | 99.8 /100 | #37 | Exceptional 11.8% |
| Immigrants | North Macedonia | 99.8 /100 | #38 | Exceptional 11.8% |
| Latvians | 99.8 /100 | #39 | Exceptional 11.8% |
| Immigrants | Bulgaria | 99.8 /100 | #40 | Exceptional 11.8% |
| Immigrants | Indonesia | 99.8 /100 | #41 | Exceptional 11.8% |
| Immigrants | Turkey | 99.7 /100 | #42 | Exceptional 11.9% |
| Egyptians | 99.7 /100 | #43 | Exceptional 11.9% |
| Immigrants | Australia | 99.7 /100 | #44 | Exceptional 11.9% |
| Macedonians | 99.7 /100 | #45 | Exceptional 11.9% |
| Immigrants | Serbia | 99.7 /100 | #46 | Exceptional 11.9% |
| Koreans | 99.6 /100 | #47 | Exceptional 12.0% |
| Immigrants | Belarus | 99.6 /100 | #48 | Exceptional 12.0% |
| Immigrants | Egypt | 99.6 /100 | #49 | Exceptional 12.0% |