Immigrants from Chile vs Immigrants from Yemen Female Poverty
COMPARE
Immigrants from Chile
Immigrants from Yemen
Female Poverty
Female Poverty Comparison
Immigrants from Chile
Immigrants from Yemen
13.3%
FEMALE POVERTY
57.4/ 100
METRIC RATING
167th/ 347
METRIC RANK
22.8%
FEMALE POVERTY
0.0/ 100
METRIC RATING
342nd/ 347
METRIC RANK
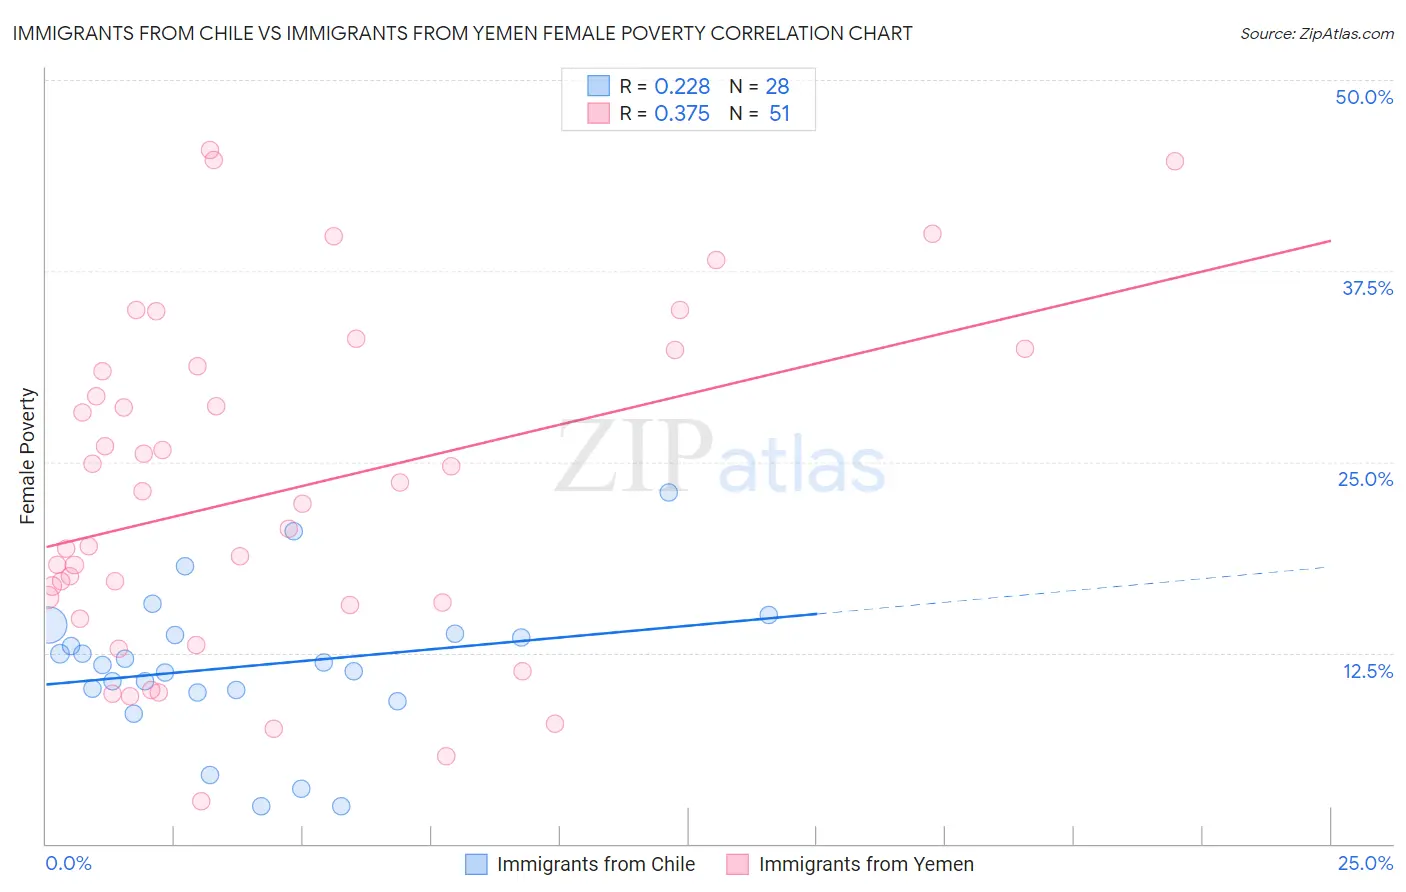
Immigrants from Chile vs Immigrants from Yemen Female Poverty Correlation Chart
The statistical analysis conducted on geographies consisting of 218,592,418 people shows a weak positive correlation between the proportion of Immigrants from Chile and poverty level among females in the United States with a correlation coefficient (R) of 0.228 and weighted average of 13.3%. Similarly, the statistical analysis conducted on geographies consisting of 82,433,611 people shows a mild positive correlation between the proportion of Immigrants from Yemen and poverty level among females in the United States with a correlation coefficient (R) of 0.375 and weighted average of 22.8%, a difference of 71.1%.
Female Poverty Correlation Summary
| Measurement | Immigrants from Chile | Immigrants from Yemen |
| Minimum | 2.4% | 2.8% |
| Maximum | 23.0% | 45.4% |
| Range | 20.6% | 42.6% |
| Mean | 11.6% | 23.0% |
| Median | 11.8% | 22.3% |
| Interquartile 25% (IQ1) | 10.0% | 15.6% |
| Interquartile 75% (IQ3) | 13.7% | 31.2% |
| Interquartile Range (IQR) | 3.8% | 15.6% |
| Standard Deviation (Sample) | 4.8% | 10.9% |
| Standard Deviation (Population) | 4.7% | 10.7% |
Similar Demographics by Female Poverty
Demographics Similar to Immigrants from Chile by Female Poverty
In terms of female poverty, the demographic groups most similar to Immigrants from Chile are Aleut (13.4%, a difference of 0.060%), Lebanese (13.4%, a difference of 0.14%), Colombian (13.4%, a difference of 0.16%), Immigrants from Oceania (13.3%, a difference of 0.24%), and White/Caucasian (13.4%, a difference of 0.27%).
| Demographics | Rating | Rank | Female Poverty |
| Immigrants | Nepal | 62.7 /100 | #160 | Good 13.3% |
| Immigrants | Ethiopia | 62.5 /100 | #161 | Good 13.3% |
| Guamanians/Chamorros | 62.4 /100 | #162 | Good 13.3% |
| Immigrants | Albania | 62.4 /100 | #163 | Good 13.3% |
| Ethiopians | 62.3 /100 | #164 | Good 13.3% |
| Scotch-Irish | 62.1 /100 | #165 | Good 13.3% |
| Immigrants | Oceania | 59.7 /100 | #166 | Average 13.3% |
| Immigrants | Chile | 57.4 /100 | #167 | Average 13.3% |
| Aleuts | 56.7 /100 | #168 | Average 13.4% |
| Lebanese | 55.9 /100 | #169 | Average 13.4% |
| Colombians | 55.7 /100 | #170 | Average 13.4% |
| Whites/Caucasians | 54.6 /100 | #171 | Average 13.4% |
| Mongolians | 53.6 /100 | #172 | Average 13.4% |
| Immigrants | Afghanistan | 50.8 /100 | #173 | Average 13.4% |
| Immigrants | Iraq | 50.0 /100 | #174 | Average 13.4% |
Demographics Similar to Immigrants from Yemen by Female Poverty
In terms of female poverty, the demographic groups most similar to Immigrants from Yemen are Lumbee (23.5%, a difference of 3.0%), Crow (22.1%, a difference of 3.2%), Pima (23.6%, a difference of 3.3%), Navajo (23.9%, a difference of 4.6%), and Yup'ik (21.5%, a difference of 6.3%).
| Demographics | Rating | Rank | Female Poverty |
| Immigrants | Dominican Republic | 0.0 /100 | #333 | Tragic 19.3% |
| Houma | 0.0 /100 | #334 | Tragic 20.0% |
| Cheyenne | 0.0 /100 | #335 | Tragic 20.2% |
| Pueblo | 0.0 /100 | #336 | Tragic 20.7% |
| Yuman | 0.0 /100 | #337 | Tragic 20.8% |
| Sioux | 0.0 /100 | #338 | Tragic 20.9% |
| Hopi | 0.0 /100 | #339 | Tragic 21.0% |
| Yup'ik | 0.0 /100 | #340 | Tragic 21.5% |
| Crow | 0.0 /100 | #341 | Tragic 22.1% |
| Immigrants | Yemen | 0.0 /100 | #342 | Tragic 22.8% |
| Lumbee | 0.0 /100 | #343 | Tragic 23.5% |
| Pima | 0.0 /100 | #344 | Tragic 23.6% |
| Navajo | 0.0 /100 | #345 | Tragic 23.9% |
| Puerto Ricans | 0.0 /100 | #346 | Tragic 25.2% |
| Tohono O'odham | 0.0 /100 | #347 | Tragic 25.9% |