Immigrants from Bulgaria vs Vietnamese Single Female Poverty
COMPARE
Immigrants from Bulgaria
Vietnamese
Single Female Poverty
Single Female Poverty Comparison
Immigrants from Bulgaria
Vietnamese
19.1%
SINGLE FEMALE POVERTY
99.7/ 100
METRIC RATING
58th/ 347
METRIC RANK
22.0%
SINGLE FEMALE POVERTY
4.0/ 100
METRIC RATING
237th/ 347
METRIC RANK
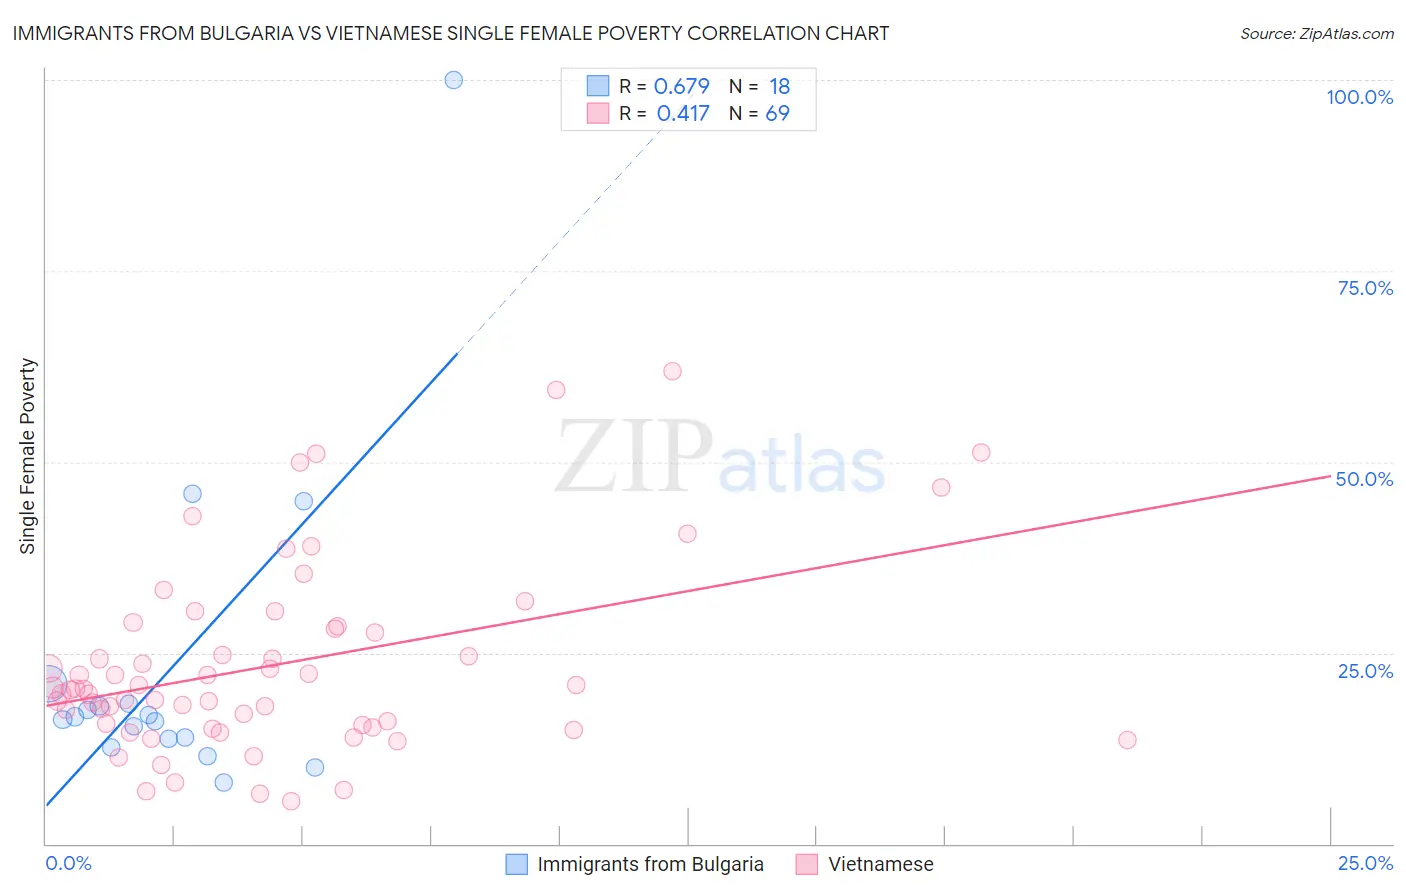
Immigrants from Bulgaria vs Vietnamese Single Female Poverty Correlation Chart
The statistical analysis conducted on geographies consisting of 171,131,313 people shows a significant positive correlation between the proportion of Immigrants from Bulgaria and poverty level among single females in the United States with a correlation coefficient (R) of 0.679 and weighted average of 19.1%. Similarly, the statistical analysis conducted on geographies consisting of 169,688,575 people shows a moderate positive correlation between the proportion of Vietnamese and poverty level among single females in the United States with a correlation coefficient (R) of 0.417 and weighted average of 22.0%, a difference of 15.1%.
Single Female Poverty Correlation Summary
| Measurement | Immigrants from Bulgaria | Vietnamese |
| Minimum | 8.1% | 5.6% |
| Maximum | 100.0% | 61.9% |
| Range | 91.9% | 56.4% |
| Mean | 23.1% | 23.4% |
| Median | 16.4% | 20.3% |
| Interquartile 25% (IQ1) | 13.7% | 15.4% |
| Interquartile 75% (IQ3) | 18.3% | 28.3% |
| Interquartile Range (IQR) | 4.6% | 12.9% |
| Standard Deviation (Sample) | 21.8% | 12.3% |
| Standard Deviation (Population) | 21.1% | 12.3% |
Similar Demographics by Single Female Poverty
Demographics Similar to Immigrants from Bulgaria by Single Female Poverty
In terms of single female poverty, the demographic groups most similar to Immigrants from Bulgaria are Sri Lankan (19.2%, a difference of 0.10%), Eastern European (19.1%, a difference of 0.12%), Immigrants from Fiji (19.1%, a difference of 0.18%), Russian (19.2%, a difference of 0.20%), and Cambodian (19.2%, a difference of 0.22%).
| Demographics | Rating | Rank | Single Female Poverty |
| Immigrants | Italy | 99.8 /100 | #51 | Exceptional 19.0% |
| Egyptians | 99.7 /100 | #52 | Exceptional 19.1% |
| Tsimshian | 99.7 /100 | #53 | Exceptional 19.1% |
| Argentineans | 99.7 /100 | #54 | Exceptional 19.1% |
| Immigrants | Vietnam | 99.7 /100 | #55 | Exceptional 19.1% |
| Immigrants | Fiji | 99.7 /100 | #56 | Exceptional 19.1% |
| Eastern Europeans | 99.7 /100 | #57 | Exceptional 19.1% |
| Immigrants | Bulgaria | 99.7 /100 | #58 | Exceptional 19.1% |
| Sri Lankans | 99.6 /100 | #59 | Exceptional 19.2% |
| Russians | 99.6 /100 | #60 | Exceptional 19.2% |
| Cambodians | 99.6 /100 | #61 | Exceptional 19.2% |
| Lithuanians | 99.6 /100 | #62 | Exceptional 19.2% |
| Immigrants | Northern Europe | 99.6 /100 | #63 | Exceptional 19.2% |
| Immigrants | Europe | 99.6 /100 | #64 | Exceptional 19.2% |
| Cypriots | 99.6 /100 | #65 | Exceptional 19.2% |
Demographics Similar to Vietnamese by Single Female Poverty
In terms of single female poverty, the demographic groups most similar to Vietnamese are Immigrants from Ecuador (22.0%, a difference of 0.070%), Dutch (22.0%, a difference of 0.23%), Spaniard (22.0%, a difference of 0.25%), Spanish (22.0%, a difference of 0.25%), and Immigrants from Thailand (22.0%, a difference of 0.35%).
| Demographics | Rating | Rank | Single Female Poverty |
| Immigrants | Western Africa | 5.3 /100 | #230 | Tragic 22.0% |
| Welsh | 5.0 /100 | #231 | Tragic 22.0% |
| Immigrants | Thailand | 5.0 /100 | #232 | Tragic 22.0% |
| Spaniards | 4.7 /100 | #233 | Tragic 22.0% |
| Spanish | 4.7 /100 | #234 | Tragic 22.0% |
| Dutch | 4.6 /100 | #235 | Tragic 22.0% |
| Immigrants | Ecuador | 4.2 /100 | #236 | Tragic 22.0% |
| Vietnamese | 4.0 /100 | #237 | Tragic 22.0% |
| French Canadians | 2.8 /100 | #238 | Tragic 22.2% |
| Malaysians | 2.8 /100 | #239 | Tragic 22.2% |
| French | 2.3 /100 | #240 | Tragic 22.2% |
| Cape Verdeans | 2.1 /100 | #241 | Tragic 22.3% |
| Bermudans | 2.0 /100 | #242 | Tragic 22.3% |
| West Indians | 1.9 /100 | #243 | Tragic 22.3% |
| Immigrants | Middle Africa | 1.9 /100 | #244 | Tragic 22.3% |