Argentinean vs Vietnamese Single Female Poverty
COMPARE
Argentinean
Vietnamese
Single Female Poverty
Single Female Poverty Comparison
Argentineans
Vietnamese
19.1%
SINGLE FEMALE POVERTY
99.7/ 100
METRIC RATING
54th/ 347
METRIC RANK
22.0%
SINGLE FEMALE POVERTY
4.0/ 100
METRIC RATING
237th/ 347
METRIC RANK
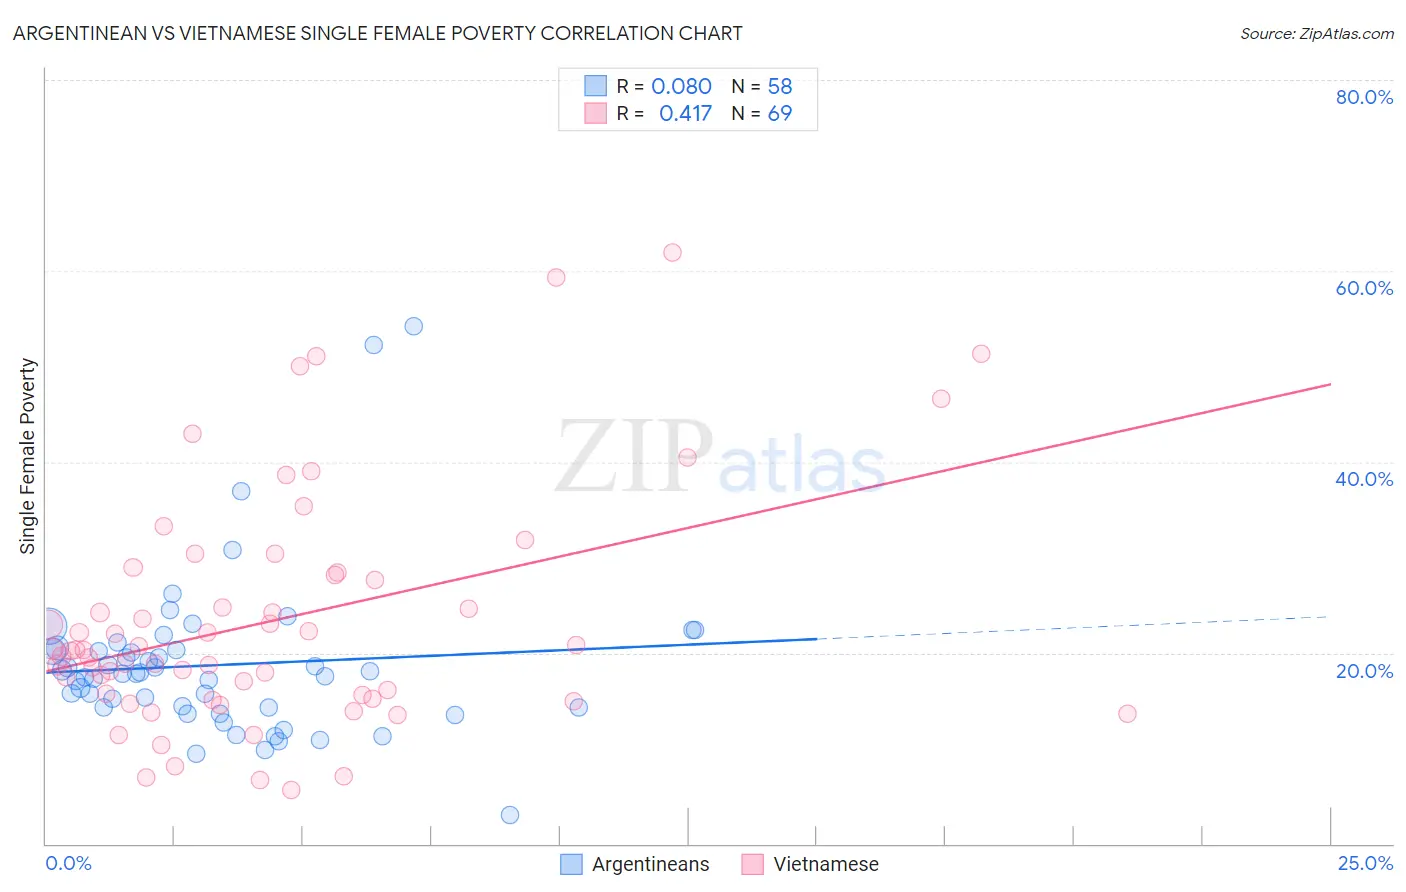
Argentinean vs Vietnamese Single Female Poverty Correlation Chart
The statistical analysis conducted on geographies consisting of 293,674,093 people shows a slight positive correlation between the proportion of Argentineans and poverty level among single females in the United States with a correlation coefficient (R) of 0.080 and weighted average of 19.1%. Similarly, the statistical analysis conducted on geographies consisting of 169,688,575 people shows a moderate positive correlation between the proportion of Vietnamese and poverty level among single females in the United States with a correlation coefficient (R) of 0.417 and weighted average of 22.0%, a difference of 15.4%.
Single Female Poverty Correlation Summary
| Measurement | Argentinean | Vietnamese |
| Minimum | 3.0% | 5.6% |
| Maximum | 54.2% | 61.9% |
| Range | 51.2% | 56.4% |
| Mean | 18.7% | 23.4% |
| Median | 17.8% | 20.3% |
| Interquartile 25% (IQ1) | 14.2% | 15.4% |
| Interquartile 75% (IQ3) | 20.3% | 28.3% |
| Interquartile Range (IQR) | 6.1% | 12.9% |
| Standard Deviation (Sample) | 8.5% | 12.3% |
| Standard Deviation (Population) | 8.4% | 12.3% |
Similar Demographics by Single Female Poverty
Demographics Similar to Argentineans by Single Female Poverty
In terms of single female poverty, the demographic groups most similar to Argentineans are Tsimshian (19.1%, a difference of 0.010%), Immigrants from Vietnam (19.1%, a difference of 0.040%), Immigrants from Fiji (19.1%, a difference of 0.090%), Eastern European (19.1%, a difference of 0.15%), and Egyptian (19.1%, a difference of 0.22%).
| Demographics | Rating | Rank | Single Female Poverty |
| Latvians | 99.8 /100 | #47 | Exceptional 19.0% |
| Immigrants | Argentina | 99.8 /100 | #48 | Exceptional 19.0% |
| Immigrants | Czechoslovakia | 99.8 /100 | #49 | Exceptional 19.0% |
| Immigrants | Eastern Europe | 99.8 /100 | #50 | Exceptional 19.0% |
| Immigrants | Italy | 99.8 /100 | #51 | Exceptional 19.0% |
| Egyptians | 99.7 /100 | #52 | Exceptional 19.1% |
| Tsimshian | 99.7 /100 | #53 | Exceptional 19.1% |
| Argentineans | 99.7 /100 | #54 | Exceptional 19.1% |
| Immigrants | Vietnam | 99.7 /100 | #55 | Exceptional 19.1% |
| Immigrants | Fiji | 99.7 /100 | #56 | Exceptional 19.1% |
| Eastern Europeans | 99.7 /100 | #57 | Exceptional 19.1% |
| Immigrants | Bulgaria | 99.7 /100 | #58 | Exceptional 19.1% |
| Sri Lankans | 99.6 /100 | #59 | Exceptional 19.2% |
| Russians | 99.6 /100 | #60 | Exceptional 19.2% |
| Cambodians | 99.6 /100 | #61 | Exceptional 19.2% |
Demographics Similar to Vietnamese by Single Female Poverty
In terms of single female poverty, the demographic groups most similar to Vietnamese are Immigrants from Ecuador (22.0%, a difference of 0.070%), Dutch (22.0%, a difference of 0.23%), Spaniard (22.0%, a difference of 0.25%), Spanish (22.0%, a difference of 0.25%), and Immigrants from Thailand (22.0%, a difference of 0.35%).
| Demographics | Rating | Rank | Single Female Poverty |
| Immigrants | Western Africa | 5.3 /100 | #230 | Tragic 22.0% |
| Welsh | 5.0 /100 | #231 | Tragic 22.0% |
| Immigrants | Thailand | 5.0 /100 | #232 | Tragic 22.0% |
| Spaniards | 4.7 /100 | #233 | Tragic 22.0% |
| Spanish | 4.7 /100 | #234 | Tragic 22.0% |
| Dutch | 4.6 /100 | #235 | Tragic 22.0% |
| Immigrants | Ecuador | 4.2 /100 | #236 | Tragic 22.0% |
| Vietnamese | 4.0 /100 | #237 | Tragic 22.0% |
| French Canadians | 2.8 /100 | #238 | Tragic 22.2% |
| Malaysians | 2.8 /100 | #239 | Tragic 22.2% |
| French | 2.3 /100 | #240 | Tragic 22.2% |
| Cape Verdeans | 2.1 /100 | #241 | Tragic 22.3% |
| Bermudans | 2.0 /100 | #242 | Tragic 22.3% |
| West Indians | 1.9 /100 | #243 | Tragic 22.3% |
| Immigrants | Middle Africa | 1.9 /100 | #244 | Tragic 22.3% |