Immigrants from Brazil vs Immigrants from Fiji Single Mother Poverty

COMPARE

Immigrants from Brazil
Race
Ancestry
AfghanAfricanAlaska NativeAlaskan AthabascanAlbanianAleutAlsatianAmericanApacheArabArapahoArgentineanArmenianAssyrian/Chaldean/SyriacAustralianAustrianBahamianBangladeshiBarbadianBasqueBelgianBelizeanBermudanBhutaneseBlackfeetBolivianBrazilianBritishBritish West IndianBulgarianBurmeseCajunCambodianCanadianCape VerdeanCarpatho RusynCelticCentral AmericanCentral American IndianCherokeeCheyenneChickasawChileanChineseChippewaChoctawColombianColvilleComancheCosta RicanCreeCreekCroatianCrowCubanCypriotCzechCzechoslovakianDanishDelawareDominicanDutchDutch West IndianEastern EuropeanEcuadorianEgyptianEnglishEstonianEthiopianEuropeanFijianFilipinoFinnishFrenchFrench American IndianFrench CanadianGermanGerman RussianGhanaianGreekGuamanian/ChamorroGuatemalanGuyaneseHaitianHmongHonduranHopiHoumaHungarianIcelanderIndian (Asian)IndonesianInupiatIranianIraqiIrishIroquoisIsraeliItalianJamaicanJapaneseJordanianKenyanKiowaKoreanLaotianLatvianLebaneseLiberianLithuanianLumbeeLuxembourgerMacedonianMalaysianMalteseMarshalleseMenomineeMexicanMexican American IndianMongolianMoroccanNative HawaiianNavajoNepaleseNew ZealanderNicaraguanNigerianNorthern EuropeanNorwegianOkinawanOsageOttawaPaiutePakistaniPalestinianPanamanianParaguayanPennsylvania GermanPeruvianPimaPolishPortuguesePotawatomiPuebloPuerto RicanPuget Sound SalishRomanianRussianSalvadoranSamoanScandinavianScotch-IrishScottishSeminoleSenegaleseSerbianShoshoneSierra LeoneanSiouxSlavicSlovakSloveneSomaliSouth AfricanSouth AmericanSouth American IndianSoviet UnionSpaniardSpanishSpanish AmericanSpanish American IndianSri LankanSubsaharan AfricanSudaneseSwedishSwissSyrianTaiwaneseThaiTlingit-HaidaTohono O'OdhamTonganTrinidadian and TobagonianTsimshianTurkishU.S. Virgin IslanderUgandanUkrainianUruguayanUteVenezuelanVietnameseWelshWest IndianYakamaYaquiYugoslavianYumanYup'ikZimbabwean
Immigration
NonimmigrantsImmigrantsAfghanistanAfricaAlbaniaArgentinaArmeniaAsiaAustraliaAustriaBahamasBangladeshBarbadosBelarusBelgiumBelizeBoliviaBosnia and HerzegovinaBrazilBulgariaBurma/MyanmarCabo VerdeCambodiaCameroonCanadaCaribbeanCentral AmericaChileChinaColombiaCongoCosta RicaCroatiaCubaCzechoslovakiaDenmarkDominicaDominican RepublicEastern AfricaEastern AsiaEastern EuropeEcuadorEgyptEl SalvadorEnglandEritreaEthiopiaEuropeFranceGermanyGhanaGreeceGrenadaGuatemalaGuyanaHaitiHondurasHong KongHungaryIndiaIndonesiaIranIraqIrelandIsraelItalyJamaicaJapanJordanKazakhstanKenyaKoreaKuwaitLaosLatin AmericaLatviaLebanonLiberiaLithuaniaMalaysiaMexicoMicronesiaMiddle AfricaMoldovaMoroccoNepalNetherlandsNicaraguaNigeriaNorth AmericaNorth MacedoniaNorthern AfricaNorthern EuropeNorwayOceaniaPakistanPanamaPeruPhilippinesPolandPortugalRomaniaRussiaSaudi ArabiaScotlandSenegalSerbiaSierra LeoneSingaporeSomaliaSouth AfricaSouth AmericaSouth Central AsiaSouth Eastern AsiaSouthern EuropeSpainSri LankaSt. Vincent and the GrenadinesSudanSwedenSwitzerlandSyriaTaiwanThailandTrinidad and TobagoTurkeyUgandaUkraineUruguayUzbekistanVenezuelaVietnamWest IndiesWestern AfricaWestern AsiaWestern EuropeYemenZaireZimbabweAzores
Immigrants from Fiji
Race
Ancestry
AfghanAfricanAlaska NativeAlaskan AthabascanAlbanianAleutAlsatianAmericanApacheArabArapahoArgentineanArmenianAssyrian/Chaldean/SyriacAustralianAustrianBahamianBangladeshiBarbadianBasqueBelgianBelizeanBermudanBhutaneseBlackfeetBolivianBrazilianBritishBritish West IndianBulgarianBurmeseCajunCambodianCanadianCape VerdeanCarpatho RusynCelticCentral AmericanCentral American IndianCherokeeCheyenneChickasawChileanChineseChippewaChoctawColombianColvilleComancheCosta RicanCreeCreekCroatianCrowCubanCypriotCzechCzechoslovakianDanishDelawareDominicanDutchDutch West IndianEastern EuropeanEcuadorianEgyptianEnglishEstonianEthiopianEuropeanFijianFilipinoFinnishFrenchFrench American IndianFrench CanadianGermanGerman RussianGhanaianGreekGuamanian/ChamorroGuatemalanGuyaneseHaitianHmongHonduranHopiHoumaHungarianIcelanderIndian (Asian)IndonesianInupiatIranianIraqiIrishIroquoisIsraeliItalianJamaicanJapaneseJordanianKenyanKiowaKoreanLaotianLatvianLebaneseLiberianLithuanianLumbeeLuxembourgerMacedonianMalaysianMalteseMarshalleseMenomineeMexicanMexican American IndianMongolianMoroccanNative HawaiianNavajoNepaleseNew ZealanderNicaraguanNigerianNorthern EuropeanNorwegianOkinawanOsageOttawaPaiutePakistaniPalestinianPanamanianParaguayanPennsylvania GermanPeruvianPimaPolishPortuguesePotawatomiPuebloPuerto RicanPuget Sound SalishRomanianRussianSalvadoranSamoanScandinavianScotch-IrishScottishSeminoleSenegaleseSerbianShoshoneSierra LeoneanSiouxSlavicSlovakSloveneSomaliSouth AfricanSouth AmericanSouth American IndianSoviet UnionSpaniardSpanishSpanish AmericanSpanish American IndianSri LankanSubsaharan AfricanSudaneseSwedishSwissSyrianTaiwaneseThaiTlingit-HaidaTohono O'OdhamTonganTrinidadian and TobagonianTsimshianTurkishU.S. Virgin IslanderUgandanUkrainianUruguayanUteVenezuelanVietnameseWelshWest IndianYakamaYaquiYugoslavianYumanYup'ikZimbabwean
Immigration
NonimmigrantsImmigrantsAfghanistanAfricaAlbaniaArgentinaArmeniaAsiaAustraliaAustriaBahamasBangladeshBarbadosBelarusBelgiumBelizeBoliviaBosnia and HerzegovinaBulgariaBurma/MyanmarCabo VerdeCambodiaCameroonCanadaCaribbeanCentral AmericaChileChinaColombiaCongoCosta RicaCroatiaCubaCzechoslovakiaDenmarkDominicaDominican RepublicEastern AfricaEastern AsiaEastern EuropeEcuadorEgyptEl SalvadorEnglandEritreaEthiopiaEuropeFijiFranceGermanyGhanaGreeceGrenadaGuatemalaGuyanaHaitiHondurasHong KongHungaryIndiaIndonesiaIranIraqIrelandIsraelItalyJamaicaJapanJordanKazakhstanKenyaKoreaKuwaitLaosLatin AmericaLatviaLebanonLiberiaLithuaniaMalaysiaMexicoMicronesiaMiddle AfricaMoldovaMoroccoNepalNetherlandsNicaraguaNigeriaNorth AmericaNorth MacedoniaNorthern AfricaNorthern EuropeNorwayOceaniaPakistanPanamaPeruPhilippinesPolandPortugalRomaniaRussiaSaudi ArabiaScotlandSenegalSerbiaSierra LeoneSingaporeSomaliaSouth AfricaSouth AmericaSouth Central AsiaSouth Eastern AsiaSouthern EuropeSpainSri LankaSt. Vincent and the GrenadinesSudanSwedenSwitzerlandSyriaTaiwanThailandTrinidad and TobagoTurkeyUgandaUkraineUruguayUzbekistanVenezuelaVietnamWest IndiesWestern AfricaWestern AsiaWestern EuropeYemenZaireZimbabweAzores
Single Mother Poverty
Income
Poverty
Unemployment
Labor Participation
Family Structure
Vehicle Availability
Education Level
Disability

Single Mother Poverty Comparison

Immigrants from Brazil

Immigrants from Fiji

Exceptional
Exceptional
27.9%
SINGLE MOTHER POVERTY
97.2/ 100
METRIC RATING
97th/ 347
METRIC RANK
26.6%
SINGLE MOTHER POVERTY
99.9/ 100
METRIC RATING
38th/ 347
METRIC RANK

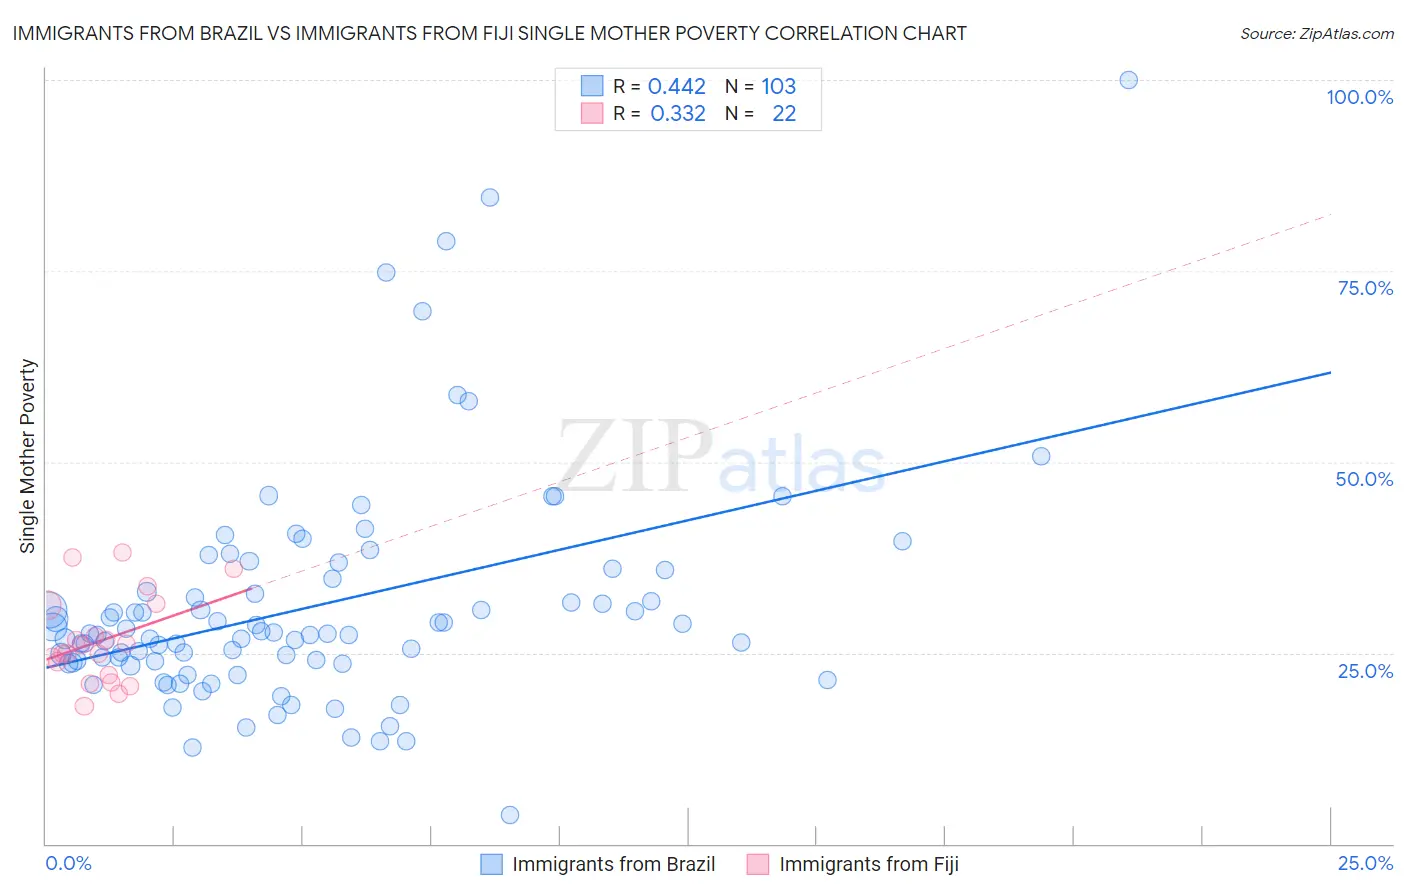
Immigrants from Brazil vs Immigrants from Fiji Single Mother Poverty Correlation Chart

The statistical analysis conducted on geographies consisting of 334,860,150 people shows a moderate positive correlation between the proportion of Immigrants from Brazil and poverty level among single mothers in the United States with a correlation coefficient (R) of 0.442 and weighted average of 27.9%. Similarly, the statistical analysis conducted on geographies consisting of 93,178,948 people shows a mild positive correlation between the proportion of Immigrants from Fiji and poverty level among single mothers in the United States with a correlation coefficient (R) of 0.332 and weighted average of 26.6%, a difference of 4.9%.
Immigrants from Brazil vs Immigrants from Fiji Single Mother Poverty

Single Mother Poverty Correlation Summary

MeasurementImmigrants from BrazilImmigrants from Fiji
Minimum3.8%18.0%
Maximum100.0%38.1%
Range96.2%20.1%
Mean31.0%26.6%
Median27.5%25.5%
Interquartile 25% (IQ1)23.7%22.0%
Interquartile 75% (IQ3)34.7%31.2%
Interquartile Range (IQR)11.1%9.2%
Standard Deviation (Sample)14.8%5.8%
Standard Deviation (Population)14.7%5.6%

Similar Demographics by Single Mother Poverty

Demographics Similar to Immigrants from Brazil by Single Mother Poverty

In terms of single mother poverty, the demographic groups most similar to Immigrants from Brazil are Immigrants from Nepal (27.9%, a difference of 0.010%), Immigrants from Netherlands (27.9%, a difference of 0.020%), Immigrants from Iraq (27.9%, a difference of 0.040%), Zimbabwean (27.9%, a difference of 0.070%), and Pakistani (28.0%, a difference of 0.13%).
DemographicsRating | RankSingle Mother Poverty
Immigrants | France
98.2
/100
|
#90
Exceptional
27.8%
Immigrants | Albania
98.0
/100
|
#91
Exceptional
27.8%
Estonians
97.9
/100
|
#92
Exceptional
27.8%
Romanians
97.8
/100
|
#93
Exceptional
27.8%
Albanians
97.6
/100
|
#94
Exceptional
27.9%
Chileans
97.5
/100
|
#95
Exceptional
27.9%
Immigrants | Iraq
97.3
/100
|
#96
Exceptional
27.9%
Immigrants | Brazil
97.2
/100
|
#97
Exceptional
27.9%
Immigrants | Nepal
97.2
/100
|
#98
Exceptional
27.9%
Immigrants | Netherlands
97.2
/100
|
#99
Exceptional
27.9%
Zimbabweans
97.1
/100
|
#100
Exceptional
27.9%
Pakistanis
96.9
/100
|
#101
Exceptional
28.0%
Immigrants | Croatia
96.7
/100
|
#102
Exceptional
28.0%
Immigrants | Northern Africa
96.6
/100
|
#103
Exceptional
28.0%
Italians
96.6
/100
|
#104
Exceptional
28.0%

Demographics Similar to Immigrants from Fiji by Single Mother Poverty

In terms of single mother poverty, the demographic groups most similar to Immigrants from Fiji are Okinawan (26.6%, a difference of 0.040%), Immigrants from Israel (26.6%, a difference of 0.040%), Maltese (26.6%, a difference of 0.090%), Immigrants from Indonesia (26.6%, a difference of 0.21%), and Bulgarian (26.5%, a difference of 0.22%).
DemographicsRating | RankSingle Mother Poverty
Immigrants | Philippines
100.0
/100
|
#31
Exceptional
26.5%
Tongans
99.9
/100
|
#32
Exceptional
26.5%
Bulgarians
99.9
/100
|
#33
Exceptional
26.5%
Immigrants | Indonesia
99.9
/100
|
#34
Exceptional
26.6%
Maltese
99.9
/100
|
#35
Exceptional
26.6%
Okinawans
99.9
/100
|
#36
Exceptional
26.6%
Immigrants | Israel
99.9
/100
|
#37
Exceptional
26.6%
Immigrants | Fiji
99.9
/100
|
#38
Exceptional
26.6%
Sri Lankans
99.9
/100
|
#39
Exceptional
26.7%
Immigrants | Vietnam
99.9
/100
|
#40
Exceptional
26.7%
Immigrants | Greece
99.9
/100
|
#41
Exceptional
26.7%
Armenians
99.9
/100
|
#42
Exceptional
26.8%
Tsimshian
99.9
/100
|
#43
Exceptional
26.8%
Immigrants | Sierra Leone
99.9
/100
|
#44
Exceptional
26.9%
Latvians
99.9
/100
|
#45
Exceptional
26.9%