Immigrants from Brazil vs Immigrants from Fiji Child Poverty Among Boys Under 16
COMPARE
Immigrants from Brazil
Immigrants from Fiji
Child Poverty Among Boys Under 16
Child Poverty Among Boys Under 16 Comparison
Immigrants from Brazil
Immigrants from Fiji
15.4%
CHILD POVERTY AMONG BOYS UNDER 16
90.3/ 100
METRIC RATING
129th/ 347
METRIC RANK
15.7%
CHILD POVERTY AMONG BOYS UNDER 16
83.6/ 100
METRIC RATING
143rd/ 347
METRIC RANK
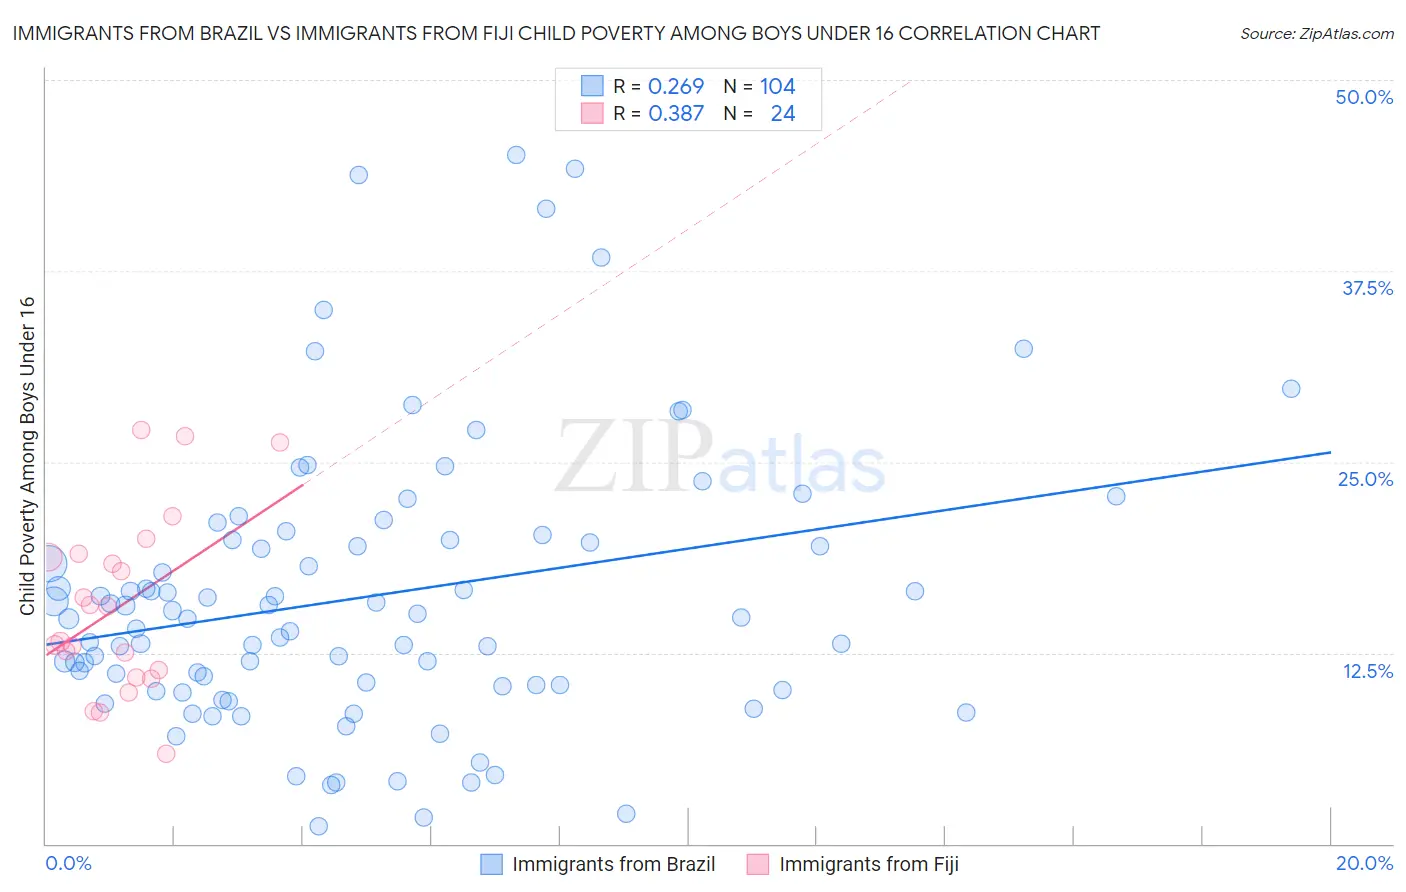
Immigrants from Brazil vs Immigrants from Fiji Child Poverty Among Boys Under 16 Correlation Chart
The statistical analysis conducted on geographies consisting of 337,720,303 people shows a weak positive correlation between the proportion of Immigrants from Brazil and poverty level among boys under the age of 16 in the United States with a correlation coefficient (R) of 0.269 and weighted average of 15.4%. Similarly, the statistical analysis conducted on geographies consisting of 93,482,281 people shows a mild positive correlation between the proportion of Immigrants from Fiji and poverty level among boys under the age of 16 in the United States with a correlation coefficient (R) of 0.387 and weighted average of 15.7%, a difference of 1.8%.
Child Poverty Among Boys Under 16 Correlation Summary
| Measurement | Immigrants from Brazil | Immigrants from Fiji |
| Minimum | 1.1% | 5.9% |
| Maximum | 45.1% | 27.1% |
| Range | 43.9% | 21.2% |
| Mean | 16.2% | 15.5% |
| Median | 14.8% | 14.4% |
| Interquartile 25% (IQ1) | 10.3% | 11.1% |
| Interquartile 75% (IQ3) | 19.9% | 18.9% |
| Interquartile Range (IQR) | 9.6% | 7.7% |
| Standard Deviation (Sample) | 9.2% | 5.8% |
| Standard Deviation (Population) | 9.1% | 5.7% |
Demographics Similar to Immigrants from Brazil and Immigrants from Fiji by Child Poverty Among Boys Under 16
In terms of child poverty among boys under 16, the demographic groups most similar to Immigrants from Brazil are Mongolian (15.4%, a difference of 0.020%), Immigrants from Western Europe (15.4%, a difference of 0.080%), Canadian (15.4%, a difference of 0.12%), Carpatho Rusyn (15.4%, a difference of 0.31%), and Palestinian (15.4%, a difference of 0.35%). Similarly, the demographic groups most similar to Immigrants from Fiji are Immigrants from Peru (15.7%, a difference of 0.020%), Samoan (15.7%, a difference of 0.080%), Immigrants from Hungary (15.7%, a difference of 0.11%), Slavic (15.7%, a difference of 0.19%), and New Zealander (15.7%, a difference of 0.24%).
| Demographics | Rating | Rank | Child Poverty Among Boys Under 16 |
| Palestinians | 91.3 /100 | #126 | Exceptional 15.4% |
| Carpatho Rusyns | 91.1 /100 | #127 | Exceptional 15.4% |
| Canadians | 90.6 /100 | #128 | Exceptional 15.4% |
| Immigrants | Brazil | 90.3 /100 | #129 | Exceptional 15.4% |
| Mongolians | 90.2 /100 | #130 | Exceptional 15.4% |
| Immigrants | Western Europe | 90.0 /100 | #131 | Exceptional 15.4% |
| Immigrants | Kazakhstan | 88.7 /100 | #132 | Excellent 15.5% |
| Welsh | 88.3 /100 | #133 | Excellent 15.5% |
| Peruvians | 88.1 /100 | #134 | Excellent 15.5% |
| Portuguese | 87.5 /100 | #135 | Excellent 15.5% |
| Icelanders | 87.5 /100 | #136 | Excellent 15.5% |
| Immigrants | Spain | 87.1 /100 | #137 | Excellent 15.6% |
| Immigrants | Southern Europe | 86.5 /100 | #138 | Excellent 15.6% |
| Albanians | 86.5 /100 | #139 | Excellent 15.6% |
| Immigrants | Kuwait | 85.6 /100 | #140 | Excellent 15.6% |
| Slavs | 84.5 /100 | #141 | Excellent 15.7% |
| Immigrants | Hungary | 84.1 /100 | #142 | Excellent 15.7% |
| Immigrants | Fiji | 83.6 /100 | #143 | Excellent 15.7% |
| Immigrants | Peru | 83.5 /100 | #144 | Excellent 15.7% |
| Samoans | 83.2 /100 | #145 | Excellent 15.7% |
| New Zealanders | 82.4 /100 | #146 | Excellent 15.7% |