Immigrants from Belize vs Samoan Child Poverty Under the Age of 16
COMPARE
Immigrants from Belize
Samoan
Child Poverty Under the Age of 16
Child Poverty Under the Age of 16 Comparison
Immigrants from Belize
Samoans
20.3%
CHILD POVERTY UNDER THE AGE OF 16
0.0/ 100
METRIC RATING
288th/ 347
METRIC RANK
15.6%
CHILD POVERTY UNDER THE AGE OF 16
77.3/ 100
METRIC RATING
154th/ 347
METRIC RANK
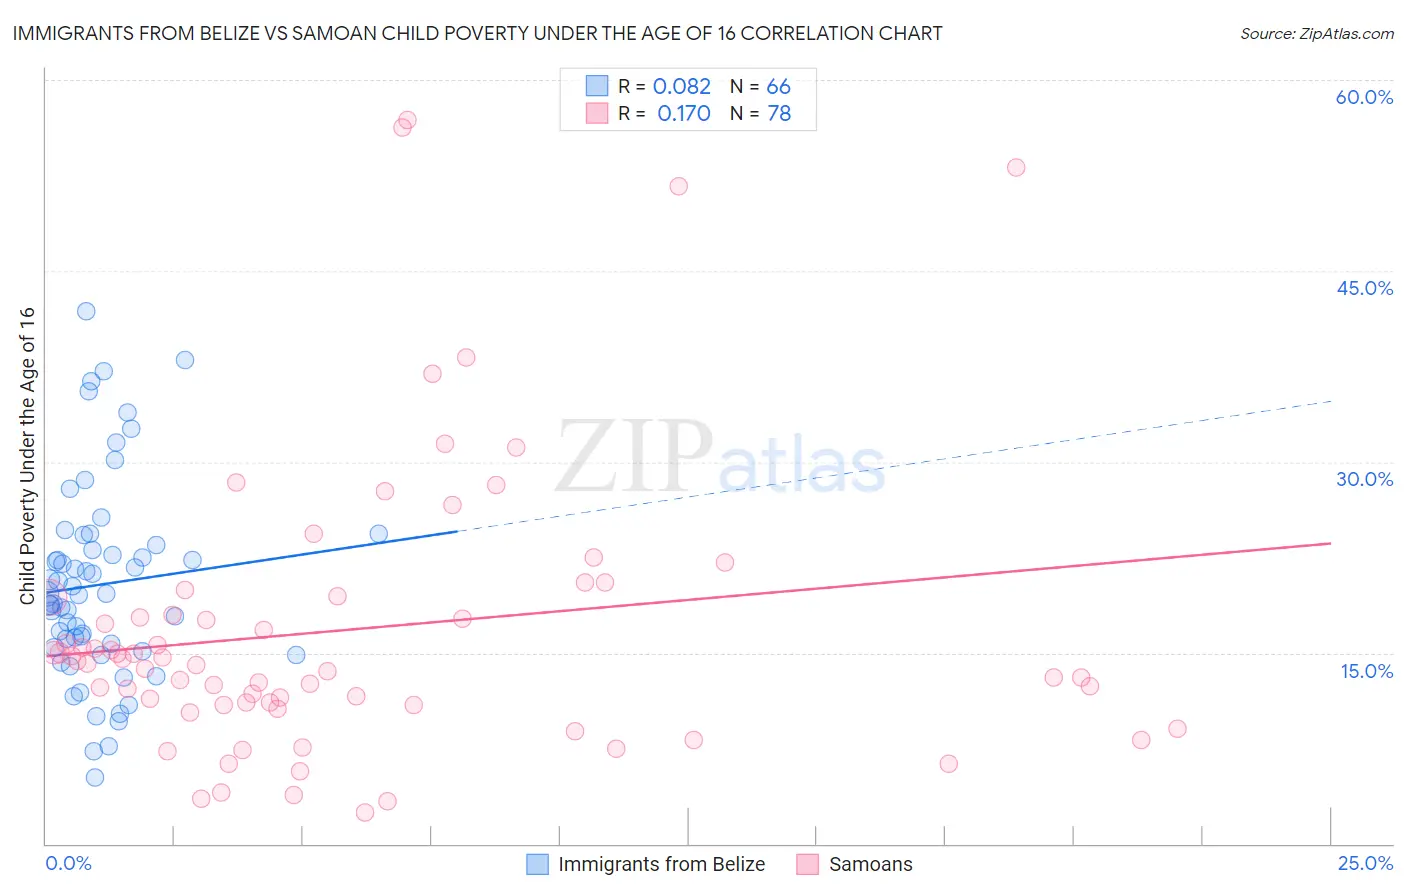
Immigrants from Belize vs Samoan Child Poverty Under the Age of 16 Correlation Chart
The statistical analysis conducted on geographies consisting of 130,133,113 people shows a slight positive correlation between the proportion of Immigrants from Belize and poverty level among children under the age of 16 in the United States with a correlation coefficient (R) of 0.082 and weighted average of 20.3%. Similarly, the statistical analysis conducted on geographies consisting of 224,526,833 people shows a poor positive correlation between the proportion of Samoans and poverty level among children under the age of 16 in the United States with a correlation coefficient (R) of 0.170 and weighted average of 15.6%, a difference of 30.1%.
Child Poverty Under the Age of 16 Correlation Summary
| Measurement | Immigrants from Belize | Samoan |
| Minimum | 5.2% | 2.5% |
| Maximum | 41.9% | 56.8% |
| Range | 36.7% | 54.4% |
| Mean | 20.4% | 16.9% |
| Median | 19.6% | 14.3% |
| Interquartile 25% (IQ1) | 15.4% | 10.9% |
| Interquartile 75% (IQ3) | 23.5% | 19.4% |
| Interquartile Range (IQR) | 8.1% | 8.5% |
| Standard Deviation (Sample) | 7.8% | 11.4% |
| Standard Deviation (Population) | 7.7% | 11.4% |
Similar Demographics by Child Poverty Under the Age of 16
Demographics Similar to Immigrants from Belize by Child Poverty Under the Age of 16
In terms of child poverty under the age of 16, the demographic groups most similar to Immigrants from Belize are Senegalese (20.4%, a difference of 0.24%), Yaqui (20.4%, a difference of 0.28%), Blackfeet (20.2%, a difference of 0.59%), Immigrants from West Indies (20.2%, a difference of 0.71%), and Immigrants from St. Vincent and the Grenadines (20.1%, a difference of 0.85%).
| Demographics | Rating | Rank | Child Poverty Under the Age of 16 |
| Central Americans | 0.0 /100 | #281 | Tragic 20.0% |
| Barbadians | 0.0 /100 | #282 | Tragic 20.0% |
| Immigrants | Zaire | 0.0 /100 | #283 | Tragic 20.1% |
| West Indians | 0.0 /100 | #284 | Tragic 20.1% |
| Immigrants | St. Vincent and the Grenadines | 0.0 /100 | #285 | Tragic 20.1% |
| Immigrants | West Indies | 0.0 /100 | #286 | Tragic 20.2% |
| Blackfeet | 0.0 /100 | #287 | Tragic 20.2% |
| Immigrants | Belize | 0.0 /100 | #288 | Tragic 20.3% |
| Senegalese | 0.0 /100 | #289 | Tragic 20.4% |
| Yaqui | 0.0 /100 | #290 | Tragic 20.4% |
| Chippewa | 0.0 /100 | #291 | Tragic 20.5% |
| Immigrants | Latin America | 0.0 /100 | #292 | Tragic 20.5% |
| Immigrants | Senegal | 0.0 /100 | #293 | Tragic 20.6% |
| Haitians | 0.0 /100 | #294 | Tragic 20.7% |
| Mexicans | 0.0 /100 | #295 | Tragic 20.7% |
Demographics Similar to Samoans by Child Poverty Under the Age of 16
In terms of child poverty under the age of 16, the demographic groups most similar to Samoans are Venezuelan (15.6%, a difference of 0.030%), French Canadian (15.6%, a difference of 0.18%), Syrian (15.6%, a difference of 0.21%), Immigrants from Jordan (15.6%, a difference of 0.22%), and French (15.6%, a difference of 0.22%).
| Demographics | Rating | Rank | Child Poverty Under the Age of 16 |
| Immigrants | Kuwait | 80.5 /100 | #147 | Excellent 15.5% |
| Puget Sound Salish | 80.3 /100 | #148 | Excellent 15.5% |
| Israelis | 80.1 /100 | #149 | Excellent 15.5% |
| Immigrants | Jordan | 78.5 /100 | #150 | Good 15.6% |
| French | 78.5 /100 | #151 | Good 15.6% |
| French Canadians | 78.2 /100 | #152 | Good 15.6% |
| Venezuelans | 77.4 /100 | #153 | Good 15.6% |
| Samoans | 77.3 /100 | #154 | Good 15.6% |
| Syrians | 76.1 /100 | #155 | Good 15.6% |
| Immigrants | Venezuela | 74.9 /100 | #156 | Good 15.7% |
| Immigrants | Nepal | 72.9 /100 | #157 | Good 15.7% |
| Immigrants | Chile | 72.8 /100 | #158 | Good 15.7% |
| Immigrants | Fiji | 71.1 /100 | #159 | Good 15.8% |
| Immigrants | Albania | 70.7 /100 | #160 | Good 15.8% |
| Immigrants | Northern Africa | 68.1 /100 | #161 | Good 15.8% |