Immigrants from Belize vs Navajo Child Poverty Under the Age of 16
COMPARE
Immigrants from Belize
Navajo
Child Poverty Under the Age of 16
Child Poverty Under the Age of 16 Comparison
Immigrants from Belize
Navajo
20.3%
CHILD POVERTY UNDER THE AGE OF 16
0.0/ 100
METRIC RATING
288th/ 347
METRIC RANK
30.2%
CHILD POVERTY UNDER THE AGE OF 16
0.0/ 100
METRIC RATING
344th/ 347
METRIC RANK
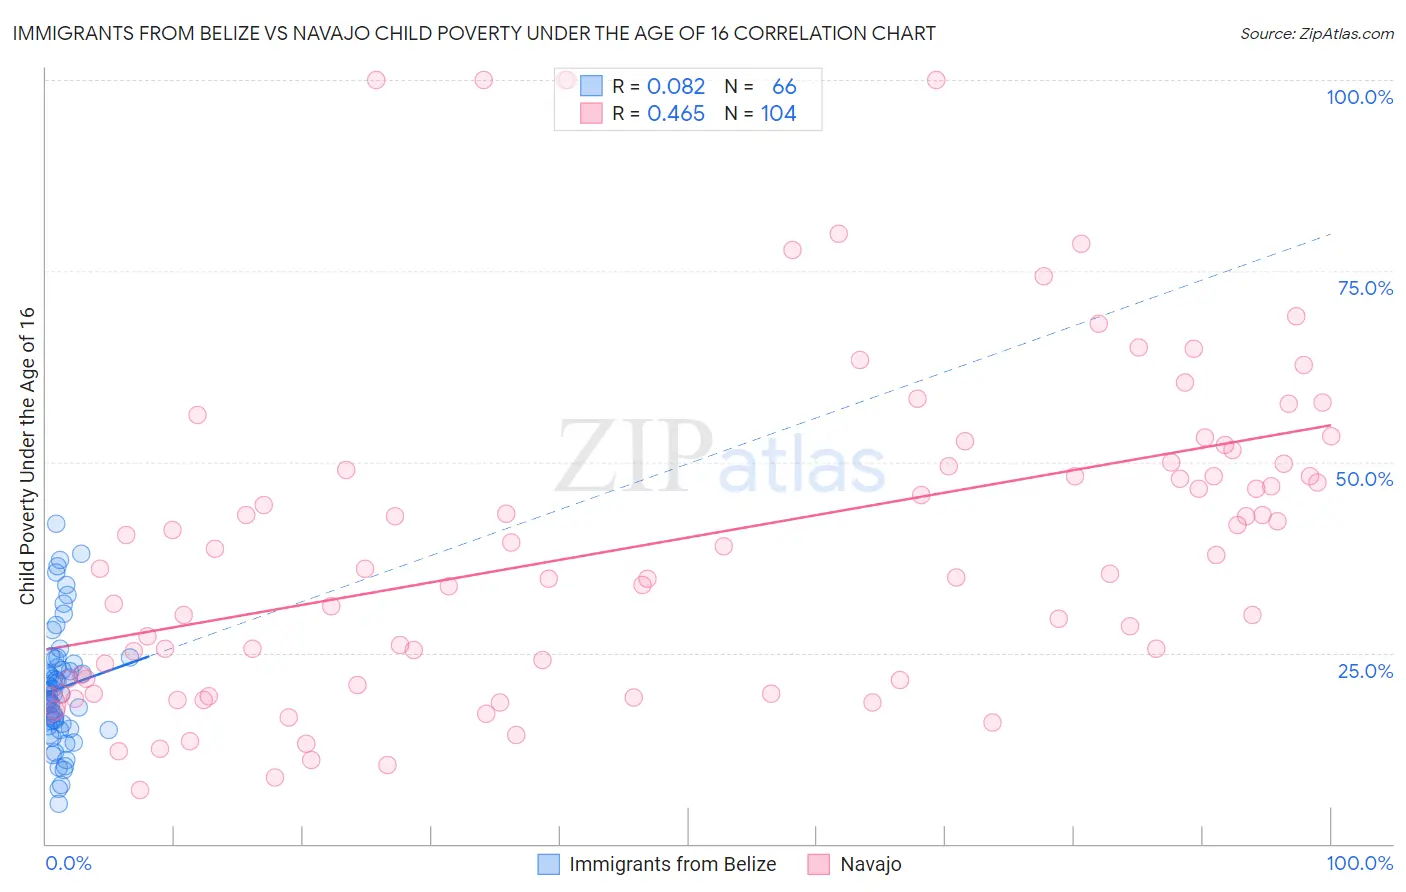
Immigrants from Belize vs Navajo Child Poverty Under the Age of 16 Correlation Chart
The statistical analysis conducted on geographies consisting of 130,133,113 people shows a slight positive correlation between the proportion of Immigrants from Belize and poverty level among children under the age of 16 in the United States with a correlation coefficient (R) of 0.082 and weighted average of 20.3%. Similarly, the statistical analysis conducted on geographies consisting of 224,099,770 people shows a moderate positive correlation between the proportion of Navajo and poverty level among children under the age of 16 in the United States with a correlation coefficient (R) of 0.465 and weighted average of 30.2%, a difference of 48.9%.
Child Poverty Under the Age of 16 Correlation Summary
| Measurement | Immigrants from Belize | Navajo |
| Minimum | 5.2% | 7.1% |
| Maximum | 41.9% | 100.0% |
| Range | 36.7% | 92.9% |
| Mean | 20.4% | 39.7% |
| Median | 19.6% | 36.9% |
| Interquartile 25% (IQ1) | 15.4% | 21.5% |
| Interquartile 75% (IQ3) | 23.5% | 49.9% |
| Interquartile Range (IQR) | 8.1% | 28.4% |
| Standard Deviation (Sample) | 7.8% | 22.0% |
| Standard Deviation (Population) | 7.7% | 21.9% |
Similar Demographics by Child Poverty Under the Age of 16
Demographics Similar to Immigrants from Belize by Child Poverty Under the Age of 16
In terms of child poverty under the age of 16, the demographic groups most similar to Immigrants from Belize are Senegalese (20.4%, a difference of 0.24%), Yaqui (20.4%, a difference of 0.28%), Blackfeet (20.2%, a difference of 0.59%), Immigrants from West Indies (20.2%, a difference of 0.71%), and Immigrants from St. Vincent and the Grenadines (20.1%, a difference of 0.85%).
| Demographics | Rating | Rank | Child Poverty Under the Age of 16 |
| Central Americans | 0.0 /100 | #281 | Tragic 20.0% |
| Barbadians | 0.0 /100 | #282 | Tragic 20.0% |
| Immigrants | Zaire | 0.0 /100 | #283 | Tragic 20.1% |
| West Indians | 0.0 /100 | #284 | Tragic 20.1% |
| Immigrants | St. Vincent and the Grenadines | 0.0 /100 | #285 | Tragic 20.1% |
| Immigrants | West Indies | 0.0 /100 | #286 | Tragic 20.2% |
| Blackfeet | 0.0 /100 | #287 | Tragic 20.2% |
| Immigrants | Belize | 0.0 /100 | #288 | Tragic 20.3% |
| Senegalese | 0.0 /100 | #289 | Tragic 20.4% |
| Yaqui | 0.0 /100 | #290 | Tragic 20.4% |
| Chippewa | 0.0 /100 | #291 | Tragic 20.5% |
| Immigrants | Latin America | 0.0 /100 | #292 | Tragic 20.5% |
| Immigrants | Senegal | 0.0 /100 | #293 | Tragic 20.6% |
| Haitians | 0.0 /100 | #294 | Tragic 20.7% |
| Mexicans | 0.0 /100 | #295 | Tragic 20.7% |
Demographics Similar to Navajo by Child Poverty Under the Age of 16
In terms of child poverty under the age of 16, the demographic groups most similar to Navajo are Lumbee (31.0%, a difference of 2.5%), Immigrants from Yemen (29.1%, a difference of 4.0%), Pima (29.0%, a difference of 4.2%), Yuman (28.9%, a difference of 4.4%), and Tohono O'odham (31.7%, a difference of 4.9%).
| Demographics | Rating | Rank | Child Poverty Under the Age of 16 |
| Immigrants | Dominican Republic | 0.0 /100 | #333 | Tragic 24.0% |
| Blacks/African Americans | 0.0 /100 | #334 | Tragic 24.4% |
| Houma | 0.0 /100 | #335 | Tragic 24.9% |
| Yup'ik | 0.0 /100 | #336 | Tragic 25.1% |
| Sioux | 0.0 /100 | #337 | Tragic 25.2% |
| Cheyenne | 0.0 /100 | #338 | Tragic 25.4% |
| Crow | 0.0 /100 | #339 | Tragic 26.0% |
| Hopi | 0.0 /100 | #340 | Tragic 27.1% |
| Yuman | 0.0 /100 | #341 | Tragic 28.9% |
| Pima | 0.0 /100 | #342 | Tragic 29.0% |
| Immigrants | Yemen | 0.0 /100 | #343 | Tragic 29.1% |
| Navajo | 0.0 /100 | #344 | Tragic 30.2% |
| Lumbee | 0.0 /100 | #345 | Tragic 31.0% |
| Tohono O'odham | 0.0 /100 | #346 | Tragic 31.7% |
| Puerto Ricans | 0.0 /100 | #347 | Tragic 32.5% |