Immigrants from Belarus vs Immigrants from Canada Female Poverty Among 18-24 Year Olds
COMPARE
Immigrants from Belarus
Immigrants from Canada
Female Poverty Among 18-24 Year Olds
Female Poverty Among 18-24 Year Olds Comparison
Immigrants from Belarus
Immigrants from Canada
18.5%
FEMALE POVERTY AMONG 18-24 YEAR OLDS
99.8/ 100
METRIC RATING
63rd/ 347
METRIC RANK
19.5%
FEMALE POVERTY AMONG 18-24 YEAR OLDS
92.9/ 100
METRIC RATING
130th/ 347
METRIC RANK
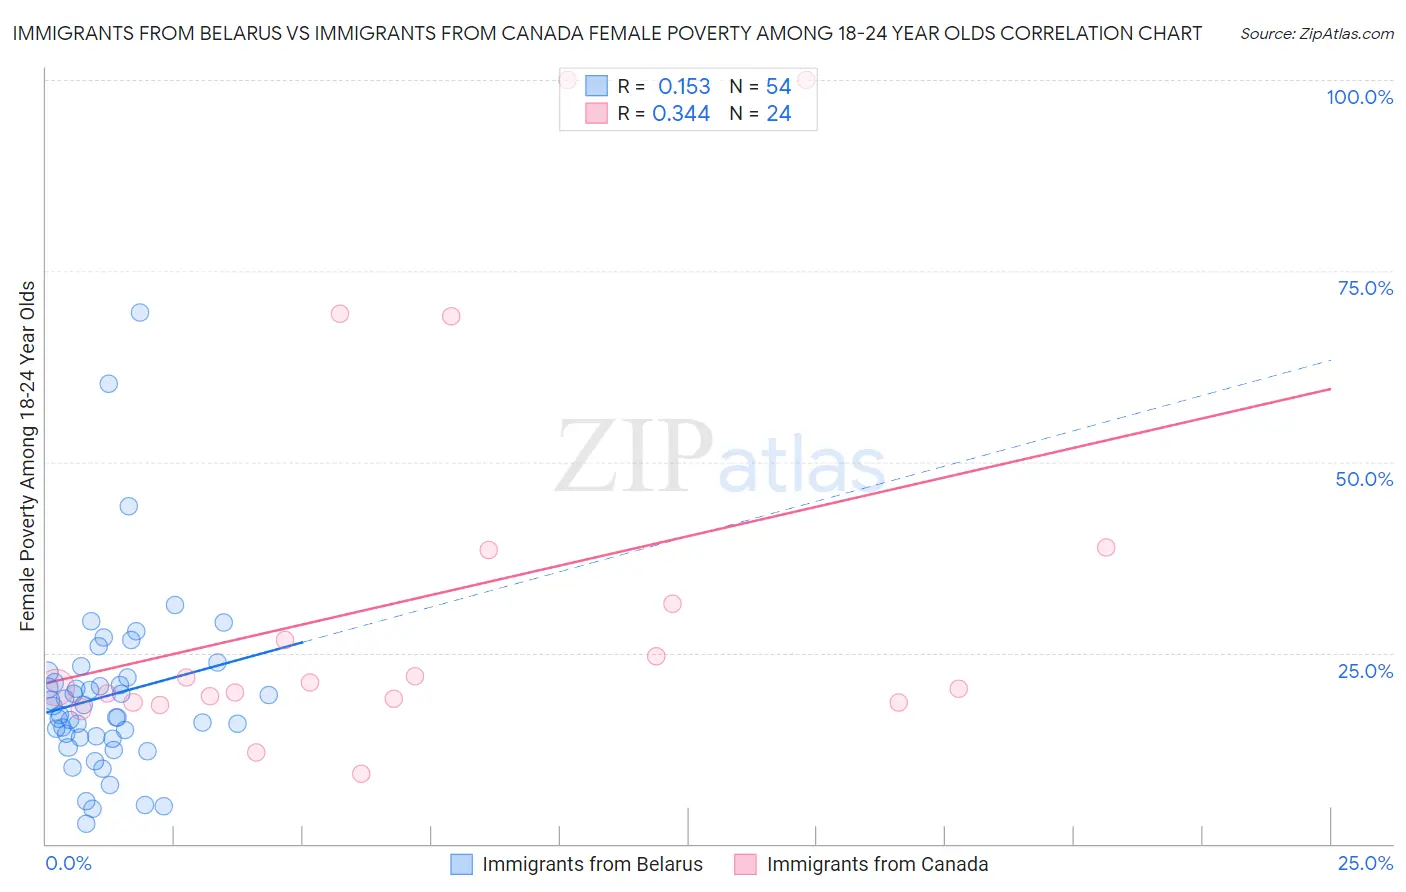
Immigrants from Belarus vs Immigrants from Canada Female Poverty Among 18-24 Year Olds Correlation Chart
The statistical analysis conducted on geographies consisting of 148,520,754 people shows a poor positive correlation between the proportion of Immigrants from Belarus and poverty level among females between the ages 18 and 24 in the United States with a correlation coefficient (R) of 0.153 and weighted average of 18.5%. Similarly, the statistical analysis conducted on geographies consisting of 442,828,957 people shows a mild positive correlation between the proportion of Immigrants from Canada and poverty level among females between the ages 18 and 24 in the United States with a correlation coefficient (R) of 0.344 and weighted average of 19.5%, a difference of 5.0%.
Female Poverty Among 18-24 Year Olds Correlation Summary
| Measurement | Immigrants from Belarus | Immigrants from Canada |
| Minimum | 2.7% | 9.1% |
| Maximum | 69.5% | 100.0% |
| Range | 66.9% | 90.9% |
| Mean | 19.4% | 32.3% |
| Median | 17.4% | 20.8% |
| Interquartile 25% (IQ1) | 14.0% | 18.7% |
| Interquartile 75% (IQ3) | 21.8% | 34.9% |
| Interquartile Range (IQR) | 7.8% | 16.2% |
| Standard Deviation (Sample) | 11.7% | 25.6% |
| Standard Deviation (Population) | 11.6% | 25.1% |
Similar Demographics by Female Poverty Among 18-24 Year Olds
Demographics Similar to Immigrants from Belarus by Female Poverty Among 18-24 Year Olds
In terms of female poverty among 18-24 year olds, the demographic groups most similar to Immigrants from Belarus are Greek (18.5%, a difference of 0.010%), Immigrants from Asia (18.6%, a difference of 0.030%), Immigrants from Scotland (18.6%, a difference of 0.060%), Immigrants from Albania (18.5%, a difference of 0.080%), and Immigrants from Brazil (18.5%, a difference of 0.13%).
| Demographics | Rating | Rank | Female Poverty Among 18-24 Year Olds |
| Argentineans | 99.9 /100 | #56 | Exceptional 18.4% |
| Immigrants | Italy | 99.9 /100 | #57 | Exceptional 18.4% |
| Immigrants | Ukraine | 99.9 /100 | #58 | Exceptional 18.4% |
| Egyptians | 99.9 /100 | #59 | Exceptional 18.5% |
| Immigrants | Brazil | 99.8 /100 | #60 | Exceptional 18.5% |
| Immigrants | Albania | 99.8 /100 | #61 | Exceptional 18.5% |
| Greeks | 99.8 /100 | #62 | Exceptional 18.5% |
| Immigrants | Belarus | 99.8 /100 | #63 | Exceptional 18.5% |
| Immigrants | Asia | 99.8 /100 | #64 | Exceptional 18.6% |
| Immigrants | Scotland | 99.8 /100 | #65 | Exceptional 18.6% |
| Jordanians | 99.8 /100 | #66 | Exceptional 18.6% |
| Immigrants | Korea | 99.8 /100 | #67 | Exceptional 18.6% |
| Brazilians | 99.8 /100 | #68 | Exceptional 18.6% |
| Immigrants | Bulgaria | 99.7 /100 | #69 | Exceptional 18.6% |
| Immigrants | Costa Rica | 99.7 /100 | #70 | Exceptional 18.7% |
Demographics Similar to Immigrants from Canada by Female Poverty Among 18-24 Year Olds
In terms of female poverty among 18-24 year olds, the demographic groups most similar to Immigrants from Canada are Immigrants from England (19.5%, a difference of 0.0%), Slovak (19.5%, a difference of 0.010%), Latvian (19.5%, a difference of 0.040%), Cape Verdean (19.4%, a difference of 0.14%), and Jamaican (19.5%, a difference of 0.14%).
| Demographics | Rating | Rank | Female Poverty Among 18-24 Year Olds |
| Paraguayans | 94.6 /100 | #123 | Exceptional 19.4% |
| Immigrants | Chile | 94.3 /100 | #124 | Exceptional 19.4% |
| Immigrants | Panama | 94.0 /100 | #125 | Exceptional 19.4% |
| Immigrants | Russia | 93.7 /100 | #126 | Exceptional 19.4% |
| Cape Verdeans | 93.6 /100 | #127 | Exceptional 19.4% |
| Slovaks | 92.9 /100 | #128 | Exceptional 19.5% |
| Immigrants | England | 92.9 /100 | #129 | Exceptional 19.5% |
| Immigrants | Canada | 92.9 /100 | #130 | Exceptional 19.5% |
| Latvians | 92.7 /100 | #131 | Exceptional 19.5% |
| Jamaicans | 92.1 /100 | #132 | Exceptional 19.5% |
| Turks | 92.1 /100 | #133 | Exceptional 19.5% |
| Immigrants | North America | 92.1 /100 | #134 | Exceptional 19.5% |
| Soviet Union | 92.0 /100 | #135 | Exceptional 19.5% |
| Russians | 91.5 /100 | #136 | Exceptional 19.5% |
| Austrians | 90.7 /100 | #137 | Exceptional 19.5% |