Immigrants from Barbados vs Danish Female Poverty
COMPARE
Immigrants from Barbados
Danish
Female Poverty
Female Poverty Comparison
Immigrants from Barbados
Danes
16.0%
FEMALE POVERTY
0.0/ 100
METRIC RATING
275th/ 347
METRIC RANK
11.7%
FEMALE POVERTY
99.5/ 100
METRIC RATING
32nd/ 347
METRIC RANK
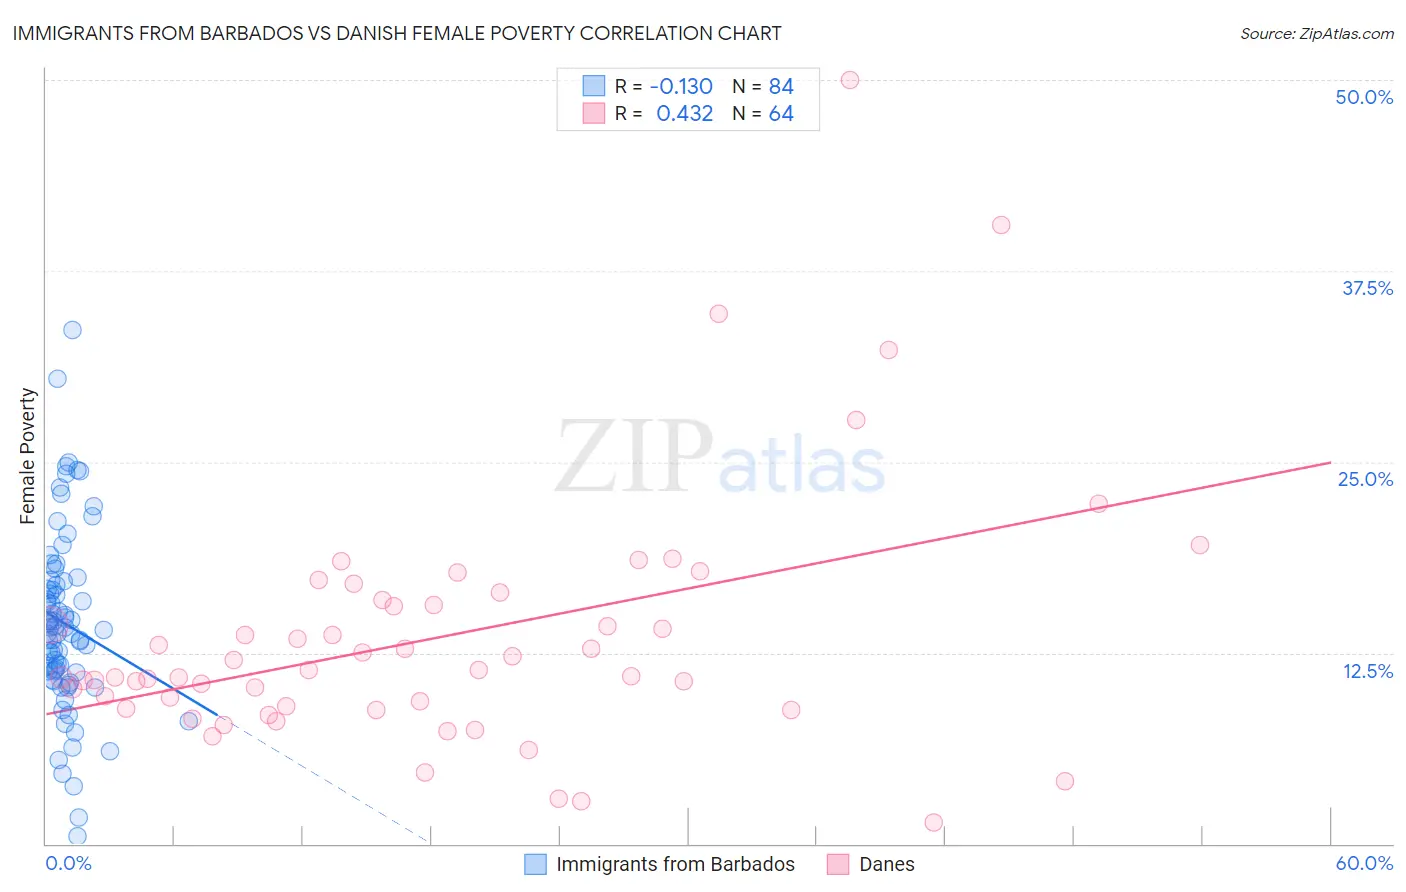
Immigrants from Barbados vs Danish Female Poverty Correlation Chart
The statistical analysis conducted on geographies consisting of 112,761,871 people shows a poor negative correlation between the proportion of Immigrants from Barbados and poverty level among females in the United States with a correlation coefficient (R) of -0.130 and weighted average of 16.0%. Similarly, the statistical analysis conducted on geographies consisting of 473,673,857 people shows a moderate positive correlation between the proportion of Danes and poverty level among females in the United States with a correlation coefficient (R) of 0.432 and weighted average of 11.7%, a difference of 35.8%.
Female Poverty Correlation Summary
| Measurement | Immigrants from Barbados | Danish |
| Minimum | 0.50% | 1.4% |
| Maximum | 33.6% | 50.0% |
| Range | 33.1% | 48.6% |
| Mean | 14.4% | 13.5% |
| Median | 14.1% | 11.2% |
| Interquartile 25% (IQ1) | 11.2% | 8.9% |
| Interquartile 75% (IQ3) | 17.1% | 15.8% |
| Interquartile Range (IQR) | 5.8% | 6.9% |
| Standard Deviation (Sample) | 5.9% | 8.4% |
| Standard Deviation (Population) | 5.8% | 8.3% |
Similar Demographics by Female Poverty
Demographics Similar to Immigrants from Barbados by Female Poverty
In terms of female poverty, the demographic groups most similar to Immigrants from Barbados are Belizean (15.9%, a difference of 0.070%), Haitian (15.9%, a difference of 0.070%), Barbadian (15.9%, a difference of 0.070%), Central American (16.0%, a difference of 0.13%), and Immigrants from St. Vincent and the Grenadines (15.9%, a difference of 0.30%).
| Demographics | Rating | Rank | Female Poverty |
| Immigrants | Nicaragua | 0.1 /100 | #268 | Tragic 15.8% |
| Iroquois | 0.1 /100 | #269 | Tragic 15.8% |
| Chickasaw | 0.1 /100 | #270 | Tragic 15.9% |
| Immigrants | St. Vincent and the Grenadines | 0.0 /100 | #271 | Tragic 15.9% |
| Belizeans | 0.0 /100 | #272 | Tragic 15.9% |
| Haitians | 0.0 /100 | #273 | Tragic 15.9% |
| Barbadians | 0.0 /100 | #274 | Tragic 15.9% |
| Immigrants | Barbados | 0.0 /100 | #275 | Tragic 16.0% |
| Central Americans | 0.0 /100 | #276 | Tragic 16.0% |
| Bangladeshis | 0.0 /100 | #277 | Tragic 16.0% |
| Immigrants | West Indies | 0.0 /100 | #278 | Tragic 16.1% |
| Immigrants | Bahamas | 0.0 /100 | #279 | Tragic 16.1% |
| Vietnamese | 0.0 /100 | #280 | Tragic 16.1% |
| West Indians | 0.0 /100 | #281 | Tragic 16.1% |
| Immigrants | Haiti | 0.0 /100 | #282 | Tragic 16.1% |
Demographics Similar to Danes by Female Poverty
In terms of female poverty, the demographic groups most similar to Danes are Cypriot (11.8%, a difference of 0.070%), Polish (11.7%, a difference of 0.13%), Immigrants from Singapore (11.8%, a difference of 0.19%), Greek (11.7%, a difference of 0.35%), and Immigrants from Iran (11.8%, a difference of 0.36%).
| Demographics | Rating | Rank | Female Poverty |
| Immigrants | Northern Europe | 99.6 /100 | #25 | Exceptional 11.6% |
| Croatians | 99.6 /100 | #26 | Exceptional 11.6% |
| Iranians | 99.6 /100 | #27 | Exceptional 11.7% |
| Immigrants | Korea | 99.6 /100 | #28 | Exceptional 11.7% |
| Immigrants | North Macedonia | 99.6 /100 | #29 | Exceptional 11.7% |
| Greeks | 99.5 /100 | #30 | Exceptional 11.7% |
| Poles | 99.5 /100 | #31 | Exceptional 11.7% |
| Danes | 99.5 /100 | #32 | Exceptional 11.7% |
| Cypriots | 99.5 /100 | #33 | Exceptional 11.8% |
| Immigrants | Singapore | 99.4 /100 | #34 | Exceptional 11.8% |
| Immigrants | Iran | 99.4 /100 | #35 | Exceptional 11.8% |
| Immigrants | Pakistan | 99.4 /100 | #36 | Exceptional 11.8% |
| Immigrants | Greece | 99.3 /100 | #37 | Exceptional 11.8% |
| Russians | 99.3 /100 | #38 | Exceptional 11.8% |
| Immigrants | Poland | 99.3 /100 | #39 | Exceptional 11.8% |