Immigrants from Bahamas vs Kenyan Family Poverty
COMPARE
Immigrants from Bahamas
Kenyan
Family Poverty
Family Poverty Comparison
Immigrants from Bahamas
Kenyans
11.1%
FAMILY POVERTY
0.1/ 100
METRIC RATING
271st/ 347
METRIC RANK
8.9%
FAMILY POVERTY
58.2/ 100
METRIC RATING
170th/ 347
METRIC RANK
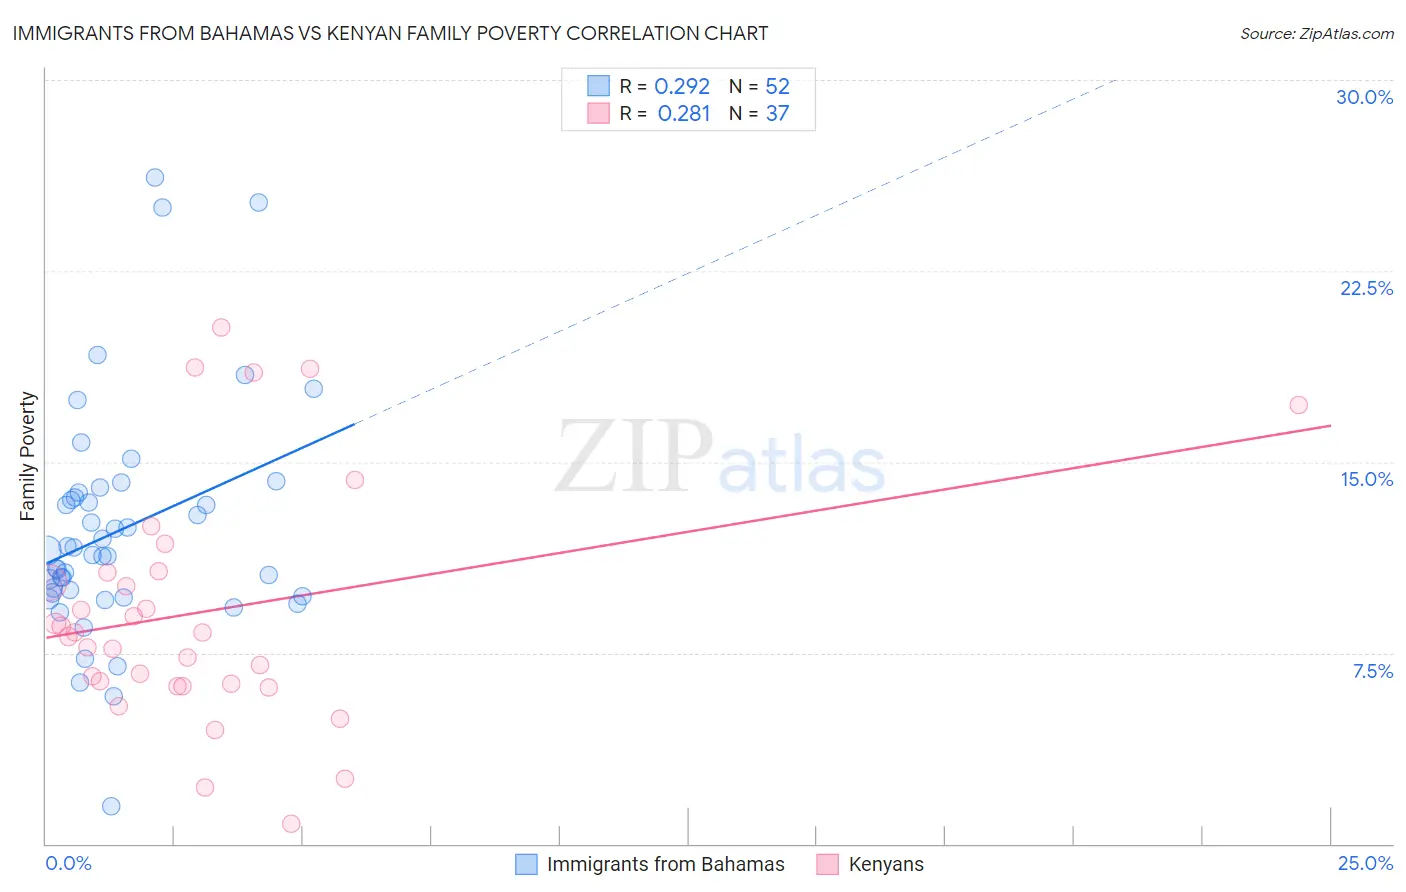
Immigrants from Bahamas vs Kenyan Family Poverty Correlation Chart
The statistical analysis conducted on geographies consisting of 104,583,559 people shows a weak positive correlation between the proportion of Immigrants from Bahamas and poverty level among families in the United States with a correlation coefficient (R) of 0.292 and weighted average of 11.1%. Similarly, the statistical analysis conducted on geographies consisting of 168,038,695 people shows a weak positive correlation between the proportion of Kenyans and poverty level among families in the United States with a correlation coefficient (R) of 0.281 and weighted average of 8.9%, a difference of 25.1%.
Family Poverty Correlation Summary
| Measurement | Immigrants from Bahamas | Kenyan |
| Minimum | 1.5% | 0.77% |
| Maximum | 26.2% | 20.3% |
| Range | 24.7% | 19.5% |
| Mean | 12.3% | 9.1% |
| Median | 11.4% | 8.3% |
| Interquartile 25% (IQ1) | 9.8% | 6.2% |
| Interquartile 75% (IQ3) | 13.7% | 10.7% |
| Interquartile Range (IQR) | 3.9% | 4.5% |
| Standard Deviation (Sample) | 4.6% | 4.7% |
| Standard Deviation (Population) | 4.5% | 4.6% |
Similar Demographics by Family Poverty
Demographics Similar to Immigrants from Bahamas by Family Poverty
In terms of family poverty, the demographic groups most similar to Immigrants from Bahamas are Immigrants from Jamaica (11.2%, a difference of 0.10%), Immigrants from Ecuador (11.1%, a difference of 0.25%), Immigrants from Nicaragua (11.1%, a difference of 0.25%), Somali (11.2%, a difference of 0.61%), and Spanish American (11.2%, a difference of 0.70%).
| Demographics | Rating | Rank | Family Poverty |
| Trinidadians and Tobagonians | 0.1 /100 | #264 | Tragic 10.9% |
| Immigrants | Trinidad and Tobago | 0.1 /100 | #265 | Tragic 10.9% |
| Immigrants | El Salvador | 0.1 /100 | #266 | Tragic 11.0% |
| Comanche | 0.1 /100 | #267 | Tragic 11.0% |
| Jamaicans | 0.1 /100 | #268 | Tragic 11.1% |
| Immigrants | Ecuador | 0.1 /100 | #269 | Tragic 11.1% |
| Immigrants | Nicaragua | 0.1 /100 | #270 | Tragic 11.1% |
| Immigrants | Bahamas | 0.1 /100 | #271 | Tragic 11.1% |
| Immigrants | Jamaica | 0.1 /100 | #272 | Tragic 11.2% |
| Somalis | 0.1 /100 | #273 | Tragic 11.2% |
| Spanish Americans | 0.1 /100 | #274 | Tragic 11.2% |
| Central Americans | 0.1 /100 | #275 | Tragic 11.2% |
| Immigrants | Guyana | 0.1 /100 | #276 | Tragic 11.2% |
| Chippewa | 0.1 /100 | #277 | Tragic 11.2% |
| Guyanese | 0.1 /100 | #278 | Tragic 11.2% |
Demographics Similar to Kenyans by Family Poverty
In terms of family poverty, the demographic groups most similar to Kenyans are Lebanese (8.9%, a difference of 0.080%), Immigrants from Peru (8.9%, a difference of 0.090%), Immigrants from Chile (8.9%, a difference of 0.19%), Immigrants from Fiji (8.9%, a difference of 0.25%), and Israeli (8.9%, a difference of 0.54%).
| Demographics | Rating | Rank | Family Poverty |
| Pennsylvania Germans | 66.0 /100 | #163 | Good 8.8% |
| Celtics | 64.9 /100 | #164 | Good 8.8% |
| Guamanians/Chamorros | 64.7 /100 | #165 | Good 8.8% |
| Afghans | 63.5 /100 | #166 | Good 8.8% |
| Immigrants | Ethiopia | 62.5 /100 | #167 | Good 8.9% |
| Israelis | 62.1 /100 | #168 | Good 8.9% |
| Immigrants | Chile | 59.6 /100 | #169 | Average 8.9% |
| Kenyans | 58.2 /100 | #170 | Average 8.9% |
| Lebanese | 57.6 /100 | #171 | Average 8.9% |
| Immigrants | Peru | 57.5 /100 | #172 | Average 8.9% |
| Immigrants | Fiji | 56.4 /100 | #173 | Average 8.9% |
| Immigrants | Albania | 50.0 /100 | #174 | Average 9.0% |
| Costa Ricans | 49.3 /100 | #175 | Average 9.0% |
| Immigrants | Syria | 47.5 /100 | #176 | Average 9.0% |
| Hawaiians | 47.2 /100 | #177 | Average 9.0% |