Immigrants from Asia vs Zimbabwean Child Poverty Under the Age of 5
COMPARE
Immigrants from Asia
Zimbabwean
Child Poverty Under the Age of 5
Child Poverty Under the Age of 5 Comparison
Immigrants from Asia
Zimbabweans
14.4%
CHILD POVERTY UNDER THE AGE OF 5
99.8/ 100
METRIC RATING
29th/ 347
METRIC RANK
15.2%
CHILD POVERTY UNDER THE AGE OF 5
99.0/ 100
METRIC RATING
68th/ 347
METRIC RANK
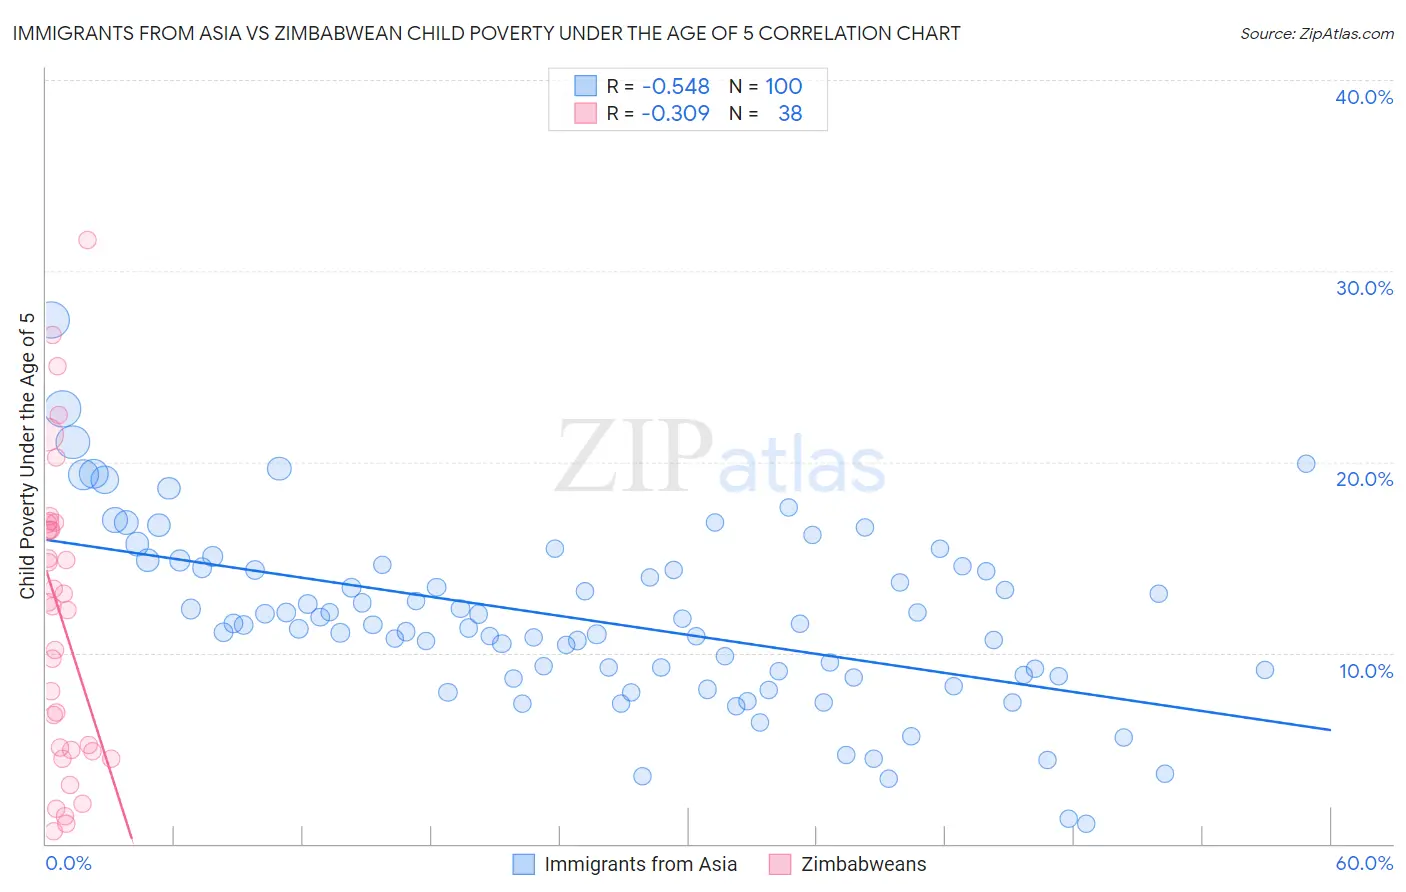
Immigrants from Asia vs Zimbabwean Child Poverty Under the Age of 5 Correlation Chart
The statistical analysis conducted on geographies consisting of 514,624,592 people shows a substantial negative correlation between the proportion of Immigrants from Asia and poverty level among children under the age of 5 in the United States with a correlation coefficient (R) of -0.548 and weighted average of 14.4%. Similarly, the statistical analysis conducted on geographies consisting of 68,606,248 people shows a mild negative correlation between the proportion of Zimbabweans and poverty level among children under the age of 5 in the United States with a correlation coefficient (R) of -0.309 and weighted average of 15.2%, a difference of 5.5%.
Child Poverty Under the Age of 5 Correlation Summary
| Measurement | Immigrants from Asia | Zimbabwean |
| Minimum | 1.0% | 0.66% |
| Maximum | 27.5% | 31.6% |
| Range | 26.4% | 31.0% |
| Mean | 11.7% | 11.9% |
| Median | 11.5% | 12.5% |
| Interquartile 25% (IQ1) | 8.8% | 4.9% |
| Interquartile 75% (IQ3) | 14.4% | 16.8% |
| Interquartile Range (IQR) | 5.6% | 11.9% |
| Standard Deviation (Sample) | 4.6% | 7.8% |
| Standard Deviation (Population) | 4.6% | 7.7% |
Similar Demographics by Child Poverty Under the Age of 5
Demographics Similar to Immigrants from Asia by Child Poverty Under the Age of 5
In terms of child poverty under the age of 5, the demographic groups most similar to Immigrants from Asia are Cambodian (14.4%, a difference of 0.050%), Korean (14.4%, a difference of 0.080%), Immigrants from Sri Lanka (14.4%, a difference of 0.36%), Immigrants from Indonesia (14.3%, a difference of 0.39%), and Taiwanese (14.5%, a difference of 0.66%).
| Demographics | Rating | Rank | Child Poverty Under the Age of 5 |
| Immigrants | Bolivia | 100.0 /100 | #22 | Exceptional 13.8% |
| Bulgarians | 99.9 /100 | #23 | Exceptional 13.9% |
| Asians | 99.9 /100 | #24 | Exceptional 14.0% |
| Cypriots | 99.9 /100 | #25 | Exceptional 14.0% |
| Immigrants | Lithuania | 99.9 /100 | #26 | Exceptional 14.1% |
| Tongans | 99.9 /100 | #27 | Exceptional 14.2% |
| Immigrants | Indonesia | 99.8 /100 | #28 | Exceptional 14.3% |
| Immigrants | Asia | 99.8 /100 | #29 | Exceptional 14.4% |
| Cambodians | 99.8 /100 | #30 | Exceptional 14.4% |
| Koreans | 99.8 /100 | #31 | Exceptional 14.4% |
| Immigrants | Sri Lanka | 99.8 /100 | #32 | Exceptional 14.4% |
| Taiwanese | 99.8 /100 | #33 | Exceptional 14.5% |
| Immigrants | Moldova | 99.8 /100 | #34 | Exceptional 14.5% |
| Latvians | 99.8 /100 | #35 | Exceptional 14.5% |
| Maltese | 99.8 /100 | #36 | Exceptional 14.5% |
Demographics Similar to Zimbabweans by Child Poverty Under the Age of 5
In terms of child poverty under the age of 5, the demographic groups most similar to Zimbabweans are Greek (15.2%, a difference of 0.0%), Lithuanian (15.2%, a difference of 0.010%), Immigrants from Scotland (15.2%, a difference of 0.070%), Immigrants from Fiji (15.2%, a difference of 0.18%), and Immigrants from Romania (15.2%, a difference of 0.21%).
| Demographics | Rating | Rank | Child Poverty Under the Age of 5 |
| Immigrants | Poland | 99.1 /100 | #61 | Exceptional 15.1% |
| Immigrants | Eastern Europe | 99.1 /100 | #62 | Exceptional 15.1% |
| Immigrants | Europe | 99.1 /100 | #63 | Exceptional 15.1% |
| Immigrants | Romania | 99.1 /100 | #64 | Exceptional 15.2% |
| Immigrants | Fiji | 99.0 /100 | #65 | Exceptional 15.2% |
| Immigrants | Scotland | 99.0 /100 | #66 | Exceptional 15.2% |
| Greeks | 99.0 /100 | #67 | Exceptional 15.2% |
| Zimbabweans | 99.0 /100 | #68 | Exceptional 15.2% |
| Lithuanians | 99.0 /100 | #69 | Exceptional 15.2% |
| Immigrants | Belgium | 98.8 /100 | #70 | Exceptional 15.3% |
| Immigrants | Egypt | 98.8 /100 | #71 | Exceptional 15.3% |
| Immigrants | Sweden | 98.8 /100 | #72 | Exceptional 15.3% |
| Immigrants | Ukraine | 98.7 /100 | #73 | Exceptional 15.3% |
| Argentineans | 98.5 /100 | #74 | Exceptional 15.4% |
| Immigrants | Argentina | 98.5 /100 | #75 | Exceptional 15.4% |