Immigrants from Asia vs Ute Child Poverty Under the Age of 5

COMPARE

Immigrants from Asia
Race
Ancestry
AfghanAfricanAlaska NativeAlaskan AthabascanAlbanianAleutAlsatianAmericanApacheArabArapahoArgentineanArmenianAssyrian/Chaldean/SyriacAustralianAustrianBahamianBangladeshiBarbadianBasqueBelgianBelizeanBermudanBhutaneseBlackfeetBolivianBrazilianBritishBritish West IndianBulgarianBurmeseCajunCambodianCanadianCape VerdeanCarpatho RusynCelticCentral AmericanCentral American IndianCherokeeCheyenneChickasawChileanChineseChippewaChoctawColombianColvilleComancheCosta RicanCreeCreekCroatianCrowCubanCypriotCzechCzechoslovakianDanishDelawareDominicanDutchDutch West IndianEastern EuropeanEcuadorianEgyptianEnglishEstonianEthiopianEuropeanFijianFilipinoFinnishFrenchFrench American IndianFrench CanadianGermanGerman RussianGhanaianGreekGuamanian/ChamorroGuatemalanGuyaneseHaitianHmongHonduranHopiHoumaHungarianIcelanderIndian (Asian)IndonesianInupiatIranianIraqiIrishIroquoisIsraeliItalianJamaicanJapaneseJordanianKenyanKiowaKoreanLaotianLatvianLebaneseLiberianLithuanianLumbeeLuxembourgerMacedonianMalaysianMalteseMarshalleseMenomineeMexicanMexican American IndianMongolianMoroccanNative HawaiianNavajoNepaleseNew ZealanderNicaraguanNigerianNorthern EuropeanNorwegianOkinawanOsageOttawaPaiutePakistaniPalestinianPanamanianParaguayanPennsylvania GermanPeruvianPimaPolishPortuguesePotawatomiPuebloPuerto RicanPuget Sound SalishRomanianRussianSalvadoranSamoanScandinavianScotch-IrishScottishSeminoleSenegaleseSerbianShoshoneSierra LeoneanSiouxSlavicSlovakSloveneSomaliSouth AfricanSouth AmericanSouth American IndianSoviet UnionSpaniardSpanishSpanish AmericanSpanish American IndianSri LankanSubsaharan AfricanSudaneseSwedishSwissSyrianTaiwaneseThaiTlingit-HaidaTohono O'OdhamTonganTrinidadian and TobagonianTsimshianTurkishU.S. Virgin IslanderUgandanUkrainianUruguayanVenezuelanVietnameseWelshWest IndianYakamaYaquiYugoslavianYumanYup'ikZimbabwean
Immigration
NonimmigrantsImmigrantsAfghanistanAfricaAlbaniaArgentinaArmeniaAsiaAustraliaAustriaBahamasBangladeshBarbadosBelarusBelgiumBelizeBoliviaBosnia and HerzegovinaBrazilBulgariaBurma/MyanmarCabo VerdeCambodiaCameroonCanadaCaribbeanCentral AmericaChileChinaColombiaCongoCosta RicaCroatiaCubaCzechoslovakiaDenmarkDominicaDominican RepublicEastern AfricaEastern AsiaEastern EuropeEcuadorEgyptEl SalvadorEnglandEritreaEthiopiaEuropeFijiFranceGermanyGhanaGreeceGrenadaGuatemalaGuyanaHaitiHondurasHong KongHungaryIndiaIndonesiaIranIraqIrelandIsraelItalyJamaicaJapanJordanKazakhstanKenyaKoreaKuwaitLaosLatin AmericaLatviaLebanonLiberiaLithuaniaMalaysiaMexicoMicronesiaMiddle AfricaMoldovaMoroccoNepalNetherlandsNicaraguaNigeriaNorth AmericaNorth MacedoniaNorthern AfricaNorthern EuropeNorwayOceaniaPakistanPanamaPeruPhilippinesPolandPortugalRomaniaRussiaSaudi ArabiaScotlandSenegalSerbiaSierra LeoneSingaporeSomaliaSouth AfricaSouth AmericaSouth Central AsiaSouth Eastern AsiaSouthern EuropeSpainSri LankaSt. Vincent and the GrenadinesSudanSwedenSwitzerlandSyriaTaiwanThailandTrinidad and TobagoTurkeyUgandaUkraineUruguayUzbekistanVenezuelaVietnamWest IndiesWestern AfricaWestern AsiaWestern EuropeYemenZaireZimbabweAzores
Ute
Race
Ancestry
AfghanAfricanAlaska NativeAlaskan AthabascanAlbanianAleutAlsatianAmericanApacheArabArapahoArgentineanArmenianAssyrian/Chaldean/SyriacAustralianAustrianBahamianBangladeshiBarbadianBasqueBelgianBelizeanBermudanBhutaneseBlackfeetBolivianBrazilianBritishBritish West IndianBulgarianBurmeseCajunCambodianCanadianCape VerdeanCarpatho RusynCelticCentral AmericanCentral American IndianCherokeeCheyenneChickasawChileanChineseChippewaChoctawColombianColvilleComancheCosta RicanCreeCreekCroatianCrowCubanCypriotCzechCzechoslovakianDanishDelawareDominicanDutchDutch West IndianEastern EuropeanEcuadorianEgyptianEnglishEstonianEthiopianEuropeanFijianFilipinoFinnishFrenchFrench American IndianFrench CanadianGermanGerman RussianGhanaianGreekGuamanian/ChamorroGuatemalanGuyaneseHaitianHmongHonduranHopiHoumaHungarianIcelanderIndian (Asian)IndonesianInupiatIranianIraqiIrishIroquoisIsraeliItalianJamaicanJapaneseJordanianKenyanKiowaKoreanLaotianLatvianLebaneseLiberianLithuanianLumbeeLuxembourgerMacedonianMalaysianMalteseMarshalleseMenomineeMexicanMexican American IndianMongolianMoroccanNative HawaiianNavajoNepaleseNew ZealanderNicaraguanNigerianNorthern EuropeanNorwegianOkinawanOsageOttawaPaiutePakistaniPalestinianPanamanianParaguayanPennsylvania GermanPeruvianPimaPolishPortuguesePotawatomiPuebloPuerto RicanPuget Sound SalishRomanianRussianSalvadoranSamoanScandinavianScotch-IrishScottishSeminoleSenegaleseSerbianShoshoneSierra LeoneanSiouxSlavicSlovakSloveneSomaliSouth AfricanSouth AmericanSouth American IndianSoviet UnionSpaniardSpanishSpanish AmericanSpanish American IndianSri LankanSubsaharan AfricanSudaneseSwedishSwissSyrianTaiwaneseThaiTlingit-HaidaTohono O'OdhamTonganTrinidadian and TobagonianTsimshianTurkishU.S. Virgin IslanderUgandanUkrainianUruguayanUteVenezuelanVietnameseWelshWest IndianYakamaYaquiYugoslavianYumanYup'ikZimbabwean
Immigration
NonimmigrantsImmigrantsAfghanistanAfricaAlbaniaArgentinaArmeniaAustraliaAustriaBahamasBangladeshBarbadosBelarusBelgiumBelizeBoliviaBosnia and HerzegovinaBrazilBulgariaBurma/MyanmarCabo VerdeCambodiaCameroonCanadaCaribbeanCentral AmericaChileChinaColombiaCongoCosta RicaCroatiaCubaCzechoslovakiaDenmarkDominicaDominican RepublicEastern AfricaEastern AsiaEastern EuropeEcuadorEgyptEl SalvadorEnglandEritreaEthiopiaEuropeFijiFranceGermanyGhanaGreeceGrenadaGuatemalaGuyanaHaitiHondurasHong KongHungaryIndiaIndonesiaIranIraqIrelandIsraelItalyJamaicaJapanJordanKazakhstanKenyaKoreaKuwaitLaosLatin AmericaLatviaLebanonLiberiaLithuaniaMalaysiaMexicoMicronesiaMiddle AfricaMoldovaMoroccoNepalNetherlandsNicaraguaNigeriaNorth AmericaNorth MacedoniaNorthern AfricaNorthern EuropeNorwayOceaniaPakistanPanamaPeruPhilippinesPolandPortugalRomaniaRussiaSaudi ArabiaScotlandSenegalSerbiaSierra LeoneSingaporeSomaliaSouth AfricaSouth AmericaSouth Central AsiaSouth Eastern AsiaSouthern EuropeSpainSri LankaSt. Vincent and the GrenadinesSudanSwedenSwitzerlandSyriaTaiwanThailandTrinidad and TobagoTurkeyUgandaUkraineUruguayUzbekistanVenezuelaVietnamWest IndiesWestern AfricaWestern AsiaWestern EuropeYemenZaireZimbabweAzores
Child Poverty Under the Age of 5
Income
Poverty
Unemployment
Labor Participation
Family Structure
Vehicle Availability
Education Level
Disability

Child Poverty Under the Age of 5 Comparison

Immigrants from Asia

Ute

Exceptional
Tragic
14.4%
CHILD POVERTY UNDER THE AGE OF 5
99.8/ 100
METRIC RATING
29th/ 347
METRIC RANK
23.5%
CHILD POVERTY UNDER THE AGE OF 5
0.0/ 100
METRIC RATING
322nd/ 347
METRIC RANK

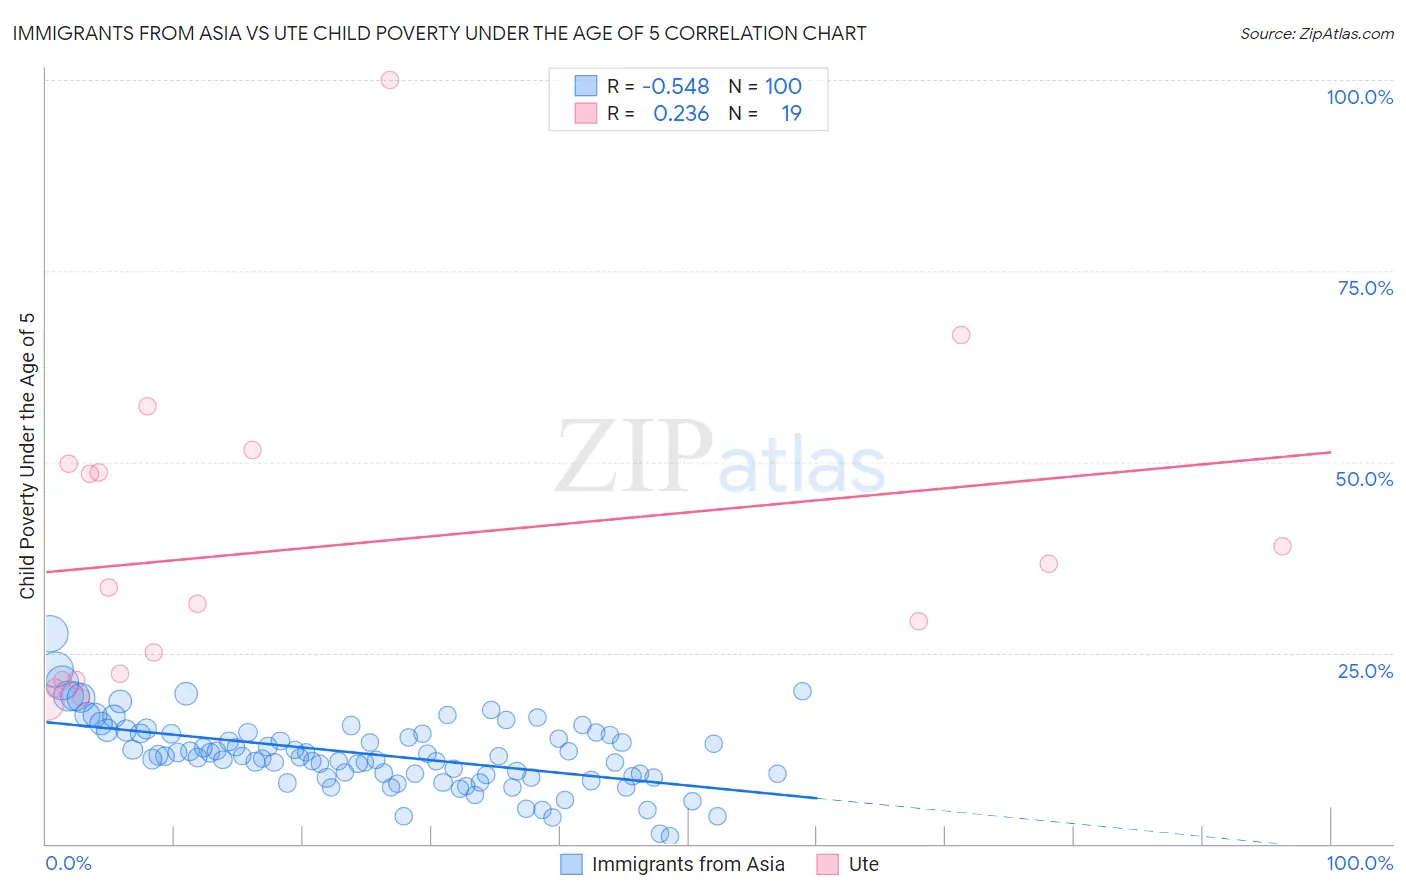
Immigrants from Asia vs Ute Child Poverty Under the Age of 5 Correlation Chart

The statistical analysis conducted on geographies consisting of 514,624,592 people shows a substantial negative correlation between the proportion of Immigrants from Asia and poverty level among children under the age of 5 in the United States with a correlation coefficient (R) of -0.548 and weighted average of 14.4%. Similarly, the statistical analysis conducted on geographies consisting of 55,277,980 people shows a weak positive correlation between the proportion of Ute and poverty level among children under the age of 5 in the United States with a correlation coefficient (R) of 0.236 and weighted average of 23.5%, a difference of 63.6%.
Immigrants from Asia vs Ute Child Poverty Under the Age of 5

Child Poverty Under the Age of 5 Correlation Summary

MeasurementImmigrants from AsiaUte
Minimum1.0%18.4%
Maximum27.5%100.0%
Range26.4%81.6%
Mean11.7%38.9%
Median11.5%33.5%
Interquartile 25% (IQ1)8.8%21.4%
Interquartile 75% (IQ3)14.4%49.7%
Interquartile Range (IQR)5.6%28.3%
Standard Deviation (Sample)4.6%20.7%
Standard Deviation (Population)4.6%20.2%

Similar Demographics by Child Poverty Under the Age of 5

Demographics Similar to Immigrants from Asia by Child Poverty Under the Age of 5

In terms of child poverty under the age of 5, the demographic groups most similar to Immigrants from Asia are Cambodian (14.4%, a difference of 0.050%), Korean (14.4%, a difference of 0.080%), Immigrants from Sri Lanka (14.4%, a difference of 0.36%), Immigrants from Indonesia (14.3%, a difference of 0.39%), and Taiwanese (14.5%, a difference of 0.66%).
DemographicsRating | RankChild Poverty Under the Age of 5
Immigrants | Bolivia
100.0
/100
|
#22
Exceptional
13.8%
Bulgarians
99.9
/100
|
#23
Exceptional
13.9%
Asians
99.9
/100
|
#24
Exceptional
14.0%
Cypriots
99.9
/100
|
#25
Exceptional
14.0%
Immigrants | Lithuania
99.9
/100
|
#26
Exceptional
14.1%
Tongans
99.9
/100
|
#27
Exceptional
14.2%
Immigrants | Indonesia
99.8
/100
|
#28
Exceptional
14.3%
Immigrants | Asia
99.8
/100
|
#29
Exceptional
14.4%
Cambodians
99.8
/100
|
#30
Exceptional
14.4%
Koreans
99.8
/100
|
#31
Exceptional
14.4%
Immigrants | Sri Lanka
99.8
/100
|
#32
Exceptional
14.4%
Taiwanese
99.8
/100
|
#33
Exceptional
14.5%
Immigrants | Moldova
99.8
/100
|
#34
Exceptional
14.5%
Latvians
99.8
/100
|
#35
Exceptional
14.5%
Maltese
99.8
/100
|
#36
Exceptional
14.5%

Demographics Similar to Ute by Child Poverty Under the Age of 5

In terms of child poverty under the age of 5, the demographic groups most similar to Ute are Immigrants from Honduras (23.5%, a difference of 0.23%), Choctaw (23.5%, a difference of 0.26%), Pueblo (23.7%, a difference of 0.58%), Chippewa (23.4%, a difference of 0.64%), and Dutch West Indian (23.3%, a difference of 1.1%).
DemographicsRating | RankChild Poverty Under the Age of 5
Arapaho
0.0
/100
|
#315
Tragic
23.1%
Yakama
0.0
/100
|
#316
Tragic
23.1%
Menominee
0.0
/100
|
#317
Tragic
23.3%
Dutch West Indians
0.0
/100
|
#318
Tragic
23.3%
Chippewa
0.0
/100
|
#319
Tragic
23.4%
Choctaw
0.0
/100
|
#320
Tragic
23.5%
Immigrants | Honduras
0.0
/100
|
#321
Tragic
23.5%
Ute
0.0
/100
|
#322
Tragic
23.5%
Pueblo
0.0
/100
|
#323
Tragic
23.7%
Paiute
0.0
/100
|
#324
Tragic
23.8%
Immigrants | Congo
0.0
/100
|
#325
Tragic
23.9%
Central American Indians
0.0
/100
|
#326
Tragic
23.9%
Dominicans
0.0
/100
|
#327
Tragic
24.0%
Immigrants | Dominican Republic
0.0
/100
|
#328
Tragic
24.1%
Cajuns
0.0
/100
|
#329
Tragic
24.1%