Icelander vs Kiowa Poverty
COMPARE
Icelander
Kiowa
Poverty
Poverty Comparison
Icelanders
Kiowa
11.9%
POVERTY
77.9/ 100
METRIC RATING
144th/ 347
METRIC RANK
16.8%
POVERTY
0.0/ 100
METRIC RATING
327th/ 347
METRIC RANK
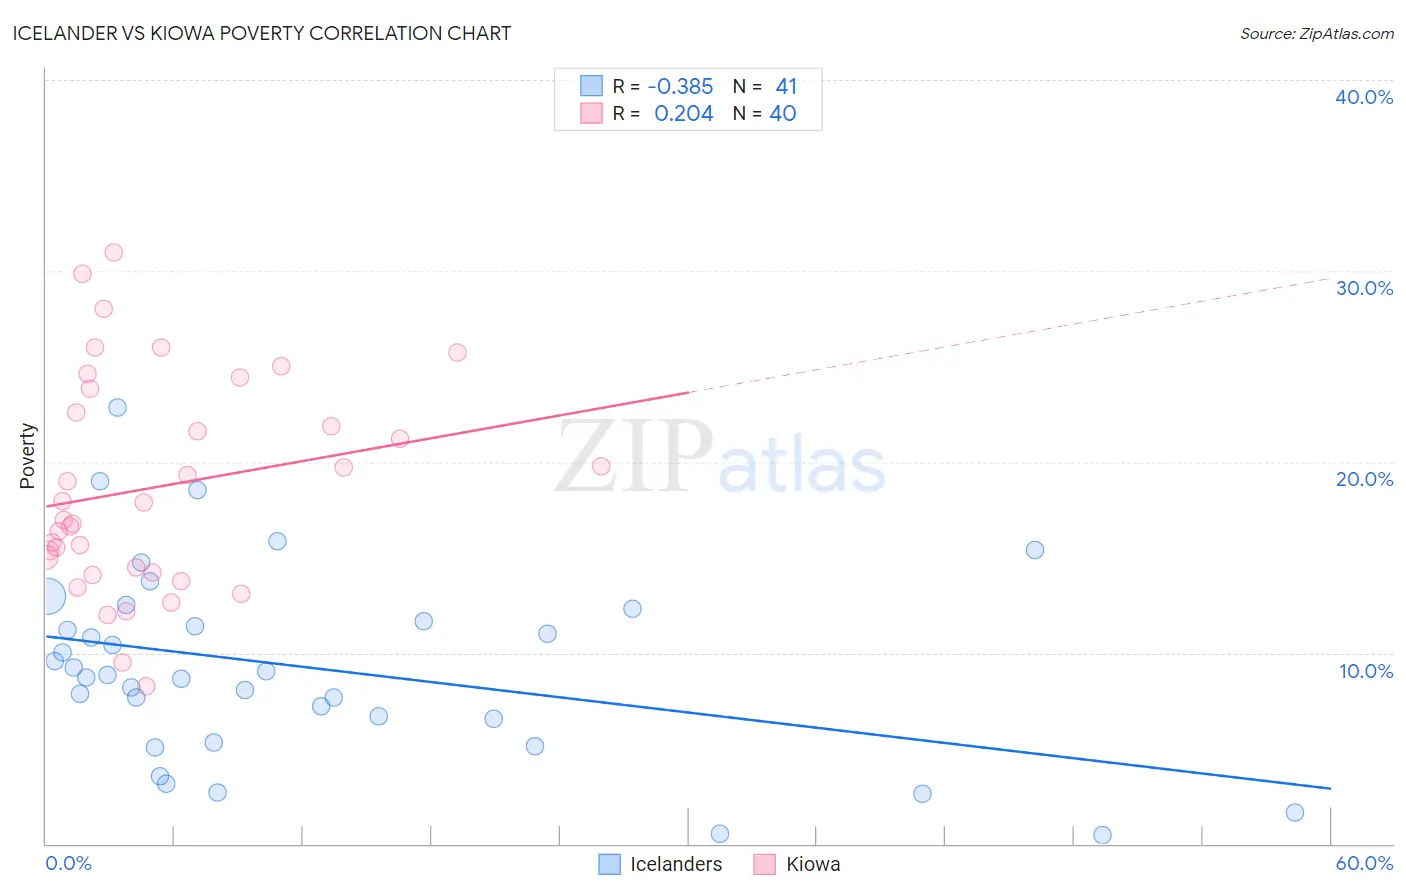
Icelander vs Kiowa Poverty Correlation Chart
The statistical analysis conducted on geographies consisting of 159,621,690 people shows a mild negative correlation between the proportion of Icelanders and poverty level in the United States with a correlation coefficient (R) of -0.385 and weighted average of 11.9%. Similarly, the statistical analysis conducted on geographies consisting of 56,099,000 people shows a weak positive correlation between the proportion of Kiowa and poverty level in the United States with a correlation coefficient (R) of 0.204 and weighted average of 16.8%, a difference of 41.0%.
Poverty Correlation Summary
| Measurement | Icelander | Kiowa |
| Minimum | 0.44% | 8.3% |
| Maximum | 22.8% | 31.0% |
| Range | 22.4% | 22.7% |
| Mean | 9.2% | 18.7% |
| Median | 8.9% | 17.4% |
| Interquartile 25% (IQ1) | 5.9% | 14.3% |
| Interquartile 75% (IQ3) | 12.0% | 23.2% |
| Interquartile Range (IQR) | 6.0% | 8.9% |
| Standard Deviation (Sample) | 5.0% | 5.6% |
| Standard Deviation (Population) | 4.9% | 5.5% |
Similar Demographics by Poverty
Demographics Similar to Icelanders by Poverty
In terms of poverty, the demographic groups most similar to Icelanders are Brazilian (11.9%, a difference of 0.27%), Basque (11.9%, a difference of 0.38%), Syrian (12.0%, a difference of 0.38%), Immigrants from France (11.9%, a difference of 0.40%), and Afghan (12.0%, a difference of 0.42%).
| Demographics | Rating | Rank | Poverty |
| Immigrants | Switzerland | 83.0 /100 | #137 | Excellent 11.8% |
| Immigrants | Jordan | 82.4 /100 | #138 | Excellent 11.9% |
| Pakistanis | 82.2 /100 | #139 | Excellent 11.9% |
| Immigrants | Peru | 81.1 /100 | #140 | Excellent 11.9% |
| Immigrants | France | 80.5 /100 | #141 | Excellent 11.9% |
| Basques | 80.4 /100 | #142 | Excellent 11.9% |
| Brazilians | 79.7 /100 | #143 | Good 11.9% |
| Icelanders | 77.9 /100 | #144 | Good 11.9% |
| Syrians | 75.1 /100 | #145 | Good 12.0% |
| Afghans | 74.9 /100 | #146 | Good 12.0% |
| Immigrants | Bosnia and Herzegovina | 73.7 /100 | #147 | Good 12.0% |
| Immigrants | Germany | 72.7 /100 | #148 | Good 12.0% |
| Immigrants | Malaysia | 72.7 /100 | #149 | Good 12.0% |
| Immigrants | Kazakhstan | 72.3 /100 | #150 | Good 12.0% |
| Samoans | 71.9 /100 | #151 | Good 12.0% |
Demographics Similar to Kiowa by Poverty
In terms of poverty, the demographic groups most similar to Kiowa are Ute (16.9%, a difference of 0.43%), Paiute (16.7%, a difference of 0.53%), Central American Indian (16.7%, a difference of 0.82%), Yakama (16.7%, a difference of 1.1%), and Colville (16.6%, a difference of 1.6%).
| Demographics | Rating | Rank | Poverty |
| Immigrants | Honduras | 0.0 /100 | #320 | Tragic 16.2% |
| Arapaho | 0.0 /100 | #321 | Tragic 16.3% |
| Menominee | 0.0 /100 | #322 | Tragic 16.4% |
| Colville | 0.0 /100 | #323 | Tragic 16.6% |
| Yakama | 0.0 /100 | #324 | Tragic 16.7% |
| Central American Indians | 0.0 /100 | #325 | Tragic 16.7% |
| Paiute | 0.0 /100 | #326 | Tragic 16.7% |
| Kiowa | 0.0 /100 | #327 | Tragic 16.8% |
| Ute | 0.0 /100 | #328 | Tragic 16.9% |
| Blacks/African Americans | 0.0 /100 | #329 | Tragic 17.3% |
| Dominicans | 0.0 /100 | #330 | Tragic 17.6% |
| Immigrants | Dominican Republic | 0.0 /100 | #331 | Tragic 17.8% |
| Natives/Alaskans | 0.0 /100 | #332 | Tragic 18.1% |
| Houma | 0.0 /100 | #333 | Tragic 18.4% |
| Apache | 0.0 /100 | #334 | Tragic 18.4% |