Icelander vs Immigrants from Cuba Single Male Poverty
COMPARE
Icelander
Immigrants from Cuba
Single Male Poverty
Single Male Poverty Comparison
Icelanders
Immigrants from Cuba
12.5%
SINGLE MALE POVERTY
88.2/ 100
METRIC RATING
121st/ 347
METRIC RANK
12.2%
SINGLE MALE POVERTY
97.3/ 100
METRIC RATING
99th/ 347
METRIC RANK
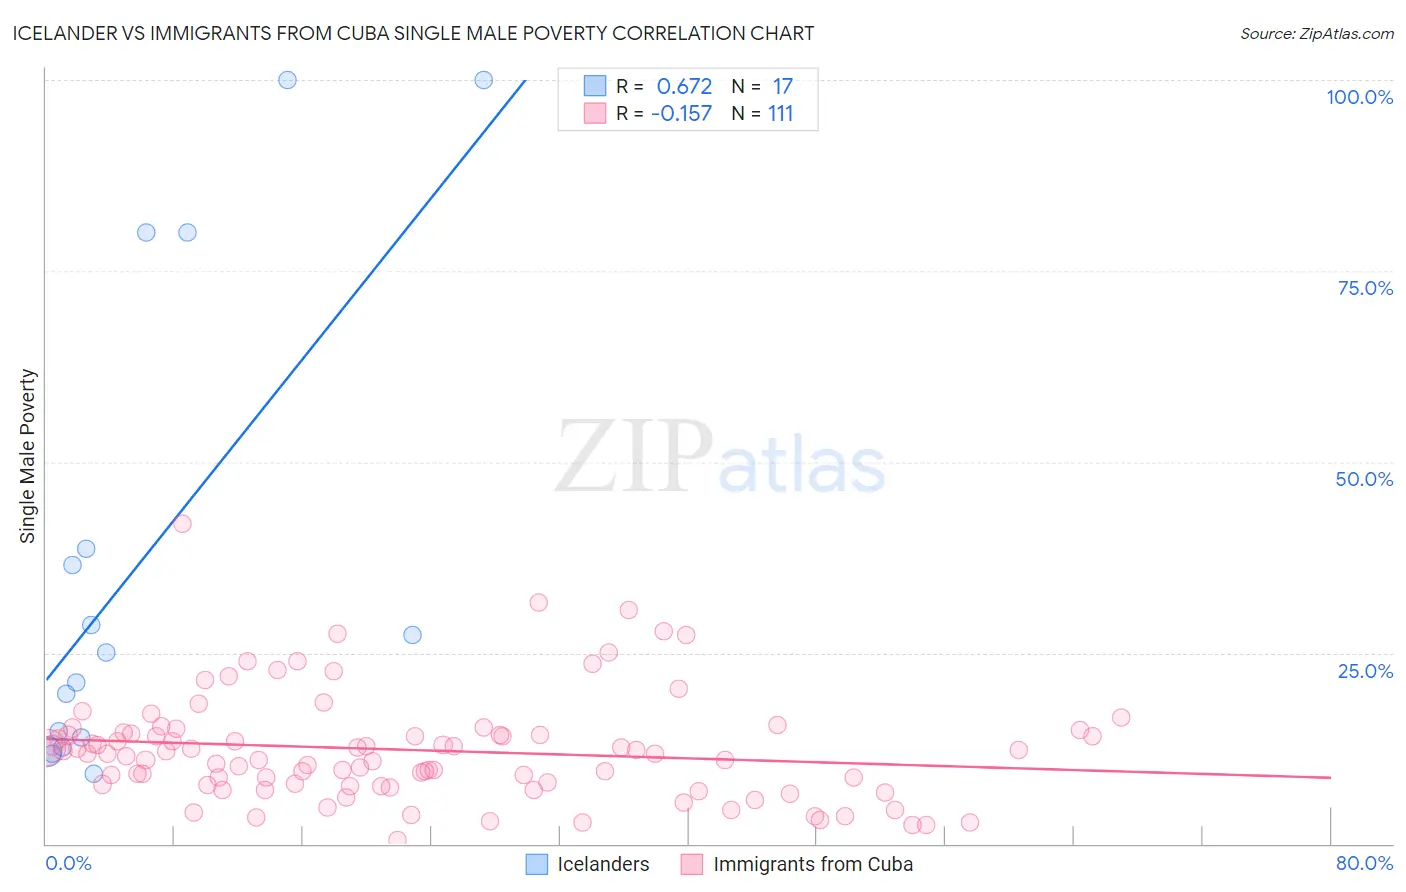
Icelander vs Immigrants from Cuba Single Male Poverty Correlation Chart
The statistical analysis conducted on geographies consisting of 148,220,666 people shows a significant positive correlation between the proportion of Icelanders and poverty level among single males in the United States with a correlation coefficient (R) of 0.672 and weighted average of 12.5%. Similarly, the statistical analysis conducted on geographies consisting of 295,328,231 people shows a poor negative correlation between the proportion of Immigrants from Cuba and poverty level among single males in the United States with a correlation coefficient (R) of -0.157 and weighted average of 12.2%, a difference of 2.2%.
Single Male Poverty Correlation Summary
| Measurement | Icelander | Immigrants from Cuba |
| Minimum | 9.1% | 0.49% |
| Maximum | 100.0% | 41.8% |
| Range | 90.9% | 41.3% |
| Mean | 37.1% | 12.3% |
| Median | 25.0% | 11.8% |
| Interquartile 25% (IQ1) | 13.3% | 7.7% |
| Interquartile 75% (IQ3) | 59.3% | 14.3% |
| Interquartile Range (IQR) | 46.1% | 6.6% |
| Standard Deviation (Sample) | 31.8% | 7.0% |
| Standard Deviation (Population) | 30.8% | 7.0% |
Similar Demographics by Single Male Poverty
Demographics Similar to Icelanders by Single Male Poverty
In terms of single male poverty, the demographic groups most similar to Icelanders are Serbian (12.5%, a difference of 0.050%), Immigrants from Kenya (12.5%, a difference of 0.090%), Russian (12.5%, a difference of 0.12%), Immigrants from Jordan (12.5%, a difference of 0.15%), and Venezuelan (12.4%, a difference of 0.16%).
| Demographics | Rating | Rank | Single Male Poverty |
| Nicaraguans | 92.1 /100 | #114 | Exceptional 12.4% |
| Immigrants | Southern Europe | 91.5 /100 | #115 | Exceptional 12.4% |
| Immigrants | Syria | 91.2 /100 | #116 | Exceptional 12.4% |
| Immigrants | Oceania | 91.1 /100 | #117 | Exceptional 12.4% |
| Albanians | 90.6 /100 | #118 | Exceptional 12.4% |
| Immigrants | Albania | 90.3 /100 | #119 | Exceptional 12.4% |
| Venezuelans | 89.4 /100 | #120 | Excellent 12.4% |
| Icelanders | 88.2 /100 | #121 | Excellent 12.5% |
| Serbians | 87.9 /100 | #122 | Excellent 12.5% |
| Immigrants | Kenya | 87.6 /100 | #123 | Excellent 12.5% |
| Russians | 87.3 /100 | #124 | Excellent 12.5% |
| Immigrants | Jordan | 87.1 /100 | #125 | Excellent 12.5% |
| Romanians | 86.4 /100 | #126 | Excellent 12.5% |
| Immigrants | Netherlands | 86.2 /100 | #127 | Excellent 12.5% |
| Ecuadorians | 85.9 /100 | #128 | Excellent 12.5% |
Demographics Similar to Immigrants from Cuba by Single Male Poverty
In terms of single male poverty, the demographic groups most similar to Immigrants from Cuba are Immigrants from Italy (12.2%, a difference of 0.040%), Guamanian/Chamorro (12.2%, a difference of 0.040%), Immigrants from Sweden (12.2%, a difference of 0.090%), Immigrants from Australia (12.2%, a difference of 0.11%), and Immigrants from Latvia (12.2%, a difference of 0.15%).
| Demographics | Rating | Rank | Single Male Poverty |
| Spanish American Indians | 98.0 /100 | #92 | Exceptional 12.1% |
| Immigrants | Bosnia and Herzegovina | 97.9 /100 | #93 | Exceptional 12.1% |
| Colombians | 97.8 /100 | #94 | Exceptional 12.2% |
| Mongolians | 97.7 /100 | #95 | Exceptional 12.2% |
| Immigrants | Sweden | 97.5 /100 | #96 | Exceptional 12.2% |
| Immigrants | Italy | 97.4 /100 | #97 | Exceptional 12.2% |
| Guamanians/Chamorros | 97.4 /100 | #98 | Exceptional 12.2% |
| Immigrants | Cuba | 97.3 /100 | #99 | Exceptional 12.2% |
| Immigrants | Australia | 97.1 /100 | #100 | Exceptional 12.2% |
| Immigrants | Latvia | 97.0 /100 | #101 | Exceptional 12.2% |
| Immigrants | Europe | 97.0 /100 | #102 | Exceptional 12.2% |
| Immigrants | Armenia | 96.7 /100 | #103 | Exceptional 12.2% |
| Immigrants | Kazakhstan | 96.7 /100 | #104 | Exceptional 12.2% |
| Jordanians | 95.9 /100 | #105 | Exceptional 12.3% |
| Immigrants | Morocco | 95.6 /100 | #106 | Exceptional 12.3% |