Hungarian vs Scotch-Irish Female Poverty Among 18-24 Year Olds
COMPARE
Hungarian
Scotch-Irish
Female Poverty Among 18-24 Year Olds
Female Poverty Among 18-24 Year Olds Comparison
Hungarians
Scotch-Irish
19.8%
FEMALE POVERTY AMONG 18-24 YEAR OLDS
76.6/ 100
METRIC RATING
155th/ 347
METRIC RANK
21.6%
FEMALE POVERTY AMONG 18-24 YEAR OLDS
0.2/ 100
METRIC RATING
271st/ 347
METRIC RANK
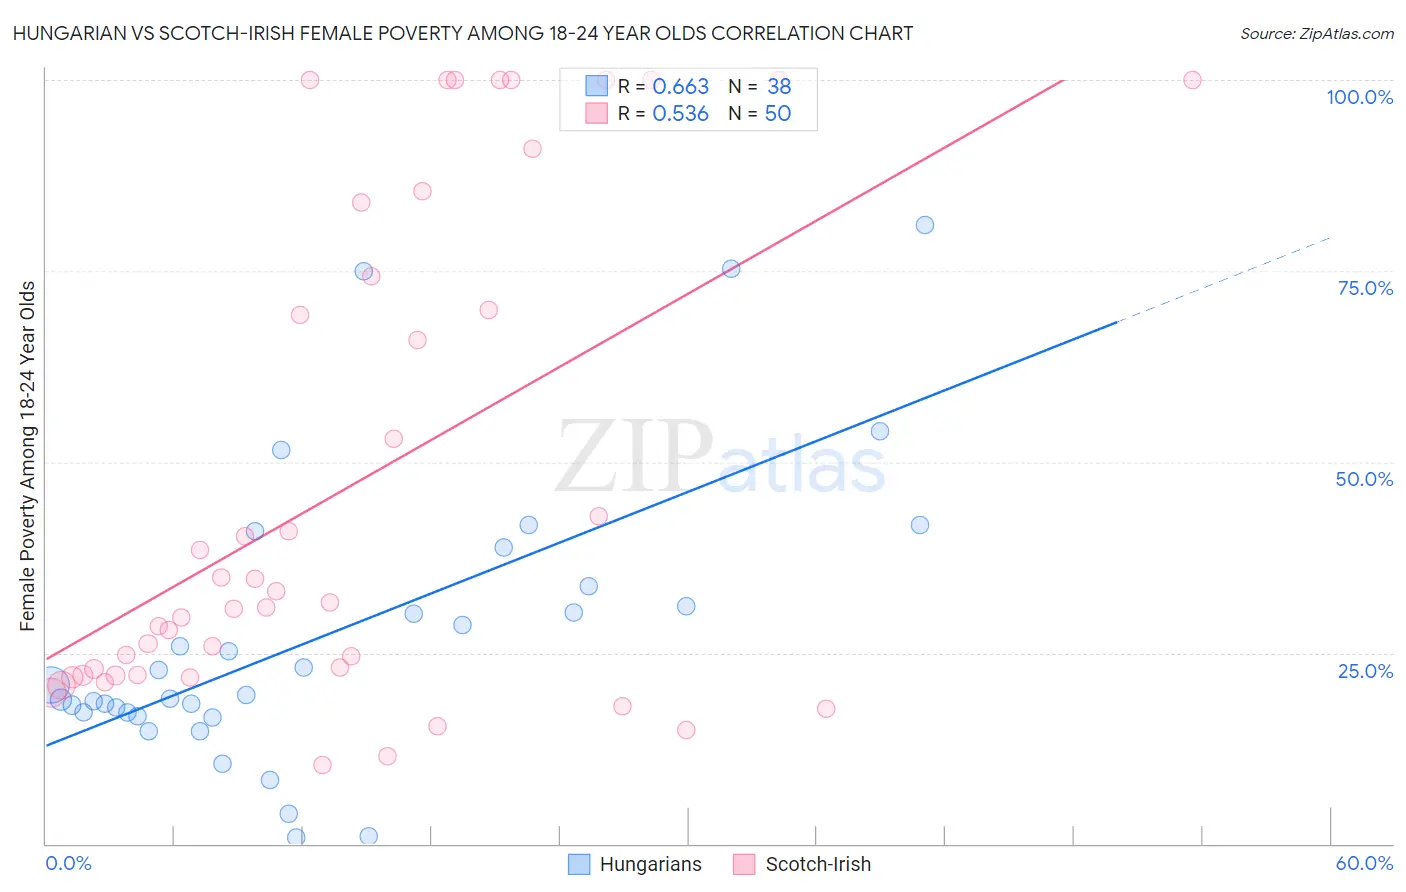
Hungarian vs Scotch-Irish Female Poverty Among 18-24 Year Olds Correlation Chart
The statistical analysis conducted on geographies consisting of 465,185,254 people shows a significant positive correlation between the proportion of Hungarians and poverty level among females between the ages 18 and 24 in the United States with a correlation coefficient (R) of 0.663 and weighted average of 19.8%. Similarly, the statistical analysis conducted on geographies consisting of 518,612,898 people shows a substantial positive correlation between the proportion of Scotch-Irish and poverty level among females between the ages 18 and 24 in the United States with a correlation coefficient (R) of 0.536 and weighted average of 21.6%, a difference of 9.1%.
Female Poverty Among 18-24 Year Olds Correlation Summary
| Measurement | Hungarian | Scotch-Irish |
| Minimum | 0.77% | 10.3% |
| Maximum | 81.0% | 100.0% |
| Range | 80.3% | 89.7% |
| Mean | 27.4% | 46.9% |
| Median | 20.1% | 31.3% |
| Interquartile 25% (IQ1) | 17.1% | 22.0% |
| Interquartile 75% (IQ3) | 33.7% | 74.3% |
| Interquartile Range (IQR) | 16.5% | 52.2% |
| Standard Deviation (Sample) | 19.2% | 31.7% |
| Standard Deviation (Population) | 18.9% | 31.4% |
Similar Demographics by Female Poverty Among 18-24 Year Olds
Demographics Similar to Hungarians by Female Poverty Among 18-24 Year Olds
In terms of female poverty among 18-24 year olds, the demographic groups most similar to Hungarians are Immigrants from Zimbabwe (19.8%, a difference of 0.0%), Immigrants from Belgium (19.8%, a difference of 0.010%), Danish (19.8%, a difference of 0.070%), Immigrants from Lebanon (19.8%, a difference of 0.090%), and Immigrants from Japan (19.8%, a difference of 0.11%).
| Demographics | Rating | Rank | Female Poverty Among 18-24 Year Olds |
| Immigrants | Latin America | 81.3 /100 | #148 | Excellent 19.7% |
| Immigrants | Oceania | 81.2 /100 | #149 | Excellent 19.7% |
| Syrians | 80.2 /100 | #150 | Excellent 19.8% |
| Immigrants | Eastern Asia | 79.7 /100 | #151 | Good 19.8% |
| Yugoslavians | 79.0 /100 | #152 | Good 19.8% |
| Immigrants | Japan | 78.1 /100 | #153 | Good 19.8% |
| Immigrants | Zimbabwe | 76.7 /100 | #154 | Good 19.8% |
| Hungarians | 76.6 /100 | #155 | Good 19.8% |
| Immigrants | Belgium | 76.4 /100 | #156 | Good 19.8% |
| Danes | 75.5 /100 | #157 | Good 19.8% |
| Immigrants | Lebanon | 75.3 /100 | #158 | Good 19.8% |
| Trinidadians and Tobagonians | 74.4 /100 | #159 | Good 19.8% |
| Pakistanis | 74.1 /100 | #160 | Good 19.8% |
| Immigrants | Belize | 74.1 /100 | #161 | Good 19.8% |
| French Canadians | 73.0 /100 | #162 | Good 19.9% |
Demographics Similar to Scotch-Irish by Female Poverty Among 18-24 Year Olds
In terms of female poverty among 18-24 year olds, the demographic groups most similar to Scotch-Irish are Mongolian (21.6%, a difference of 0.010%), Celtic (21.6%, a difference of 0.040%), Immigrants from Burma/Myanmar (21.6%, a difference of 0.10%), American (21.6%, a difference of 0.25%), and Basque (21.7%, a difference of 0.27%).
| Demographics | Rating | Rank | Female Poverty Among 18-24 Year Olds |
| Hondurans | 0.3 /100 | #264 | Tragic 21.5% |
| Immigrants | Nonimmigrants | 0.3 /100 | #265 | Tragic 21.5% |
| Alaska Natives | 0.3 /100 | #266 | Tragic 21.5% |
| Americans | 0.3 /100 | #267 | Tragic 21.6% |
| Immigrants | Burma/Myanmar | 0.2 /100 | #268 | Tragic 21.6% |
| Celtics | 0.2 /100 | #269 | Tragic 21.6% |
| Mongolians | 0.2 /100 | #270 | Tragic 21.6% |
| Scotch-Irish | 0.2 /100 | #271 | Tragic 21.6% |
| Basques | 0.2 /100 | #272 | Tragic 21.7% |
| New Zealanders | 0.2 /100 | #273 | Tragic 21.7% |
| Immigrants | Honduras | 0.1 /100 | #274 | Tragic 21.8% |
| Immigrants | Bangladesh | 0.1 /100 | #275 | Tragic 21.8% |
| Bahamians | 0.1 /100 | #276 | Tragic 21.8% |
| Immigrants | Switzerland | 0.1 /100 | #277 | Tragic 21.8% |
| Yaqui | 0.1 /100 | #278 | Tragic 21.9% |