Honduran vs Immigrants from Switzerland Family Poverty
COMPARE
Honduran
Immigrants from Switzerland
Family Poverty
Family Poverty Comparison
Hondurans
Immigrants from Switzerland
12.4%
FAMILY POVERTY
0.0/ 100
METRIC RATING
316th/ 347
METRIC RANK
8.1%
FAMILY POVERTY
96.1/ 100
METRIC RATING
97th/ 347
METRIC RANK
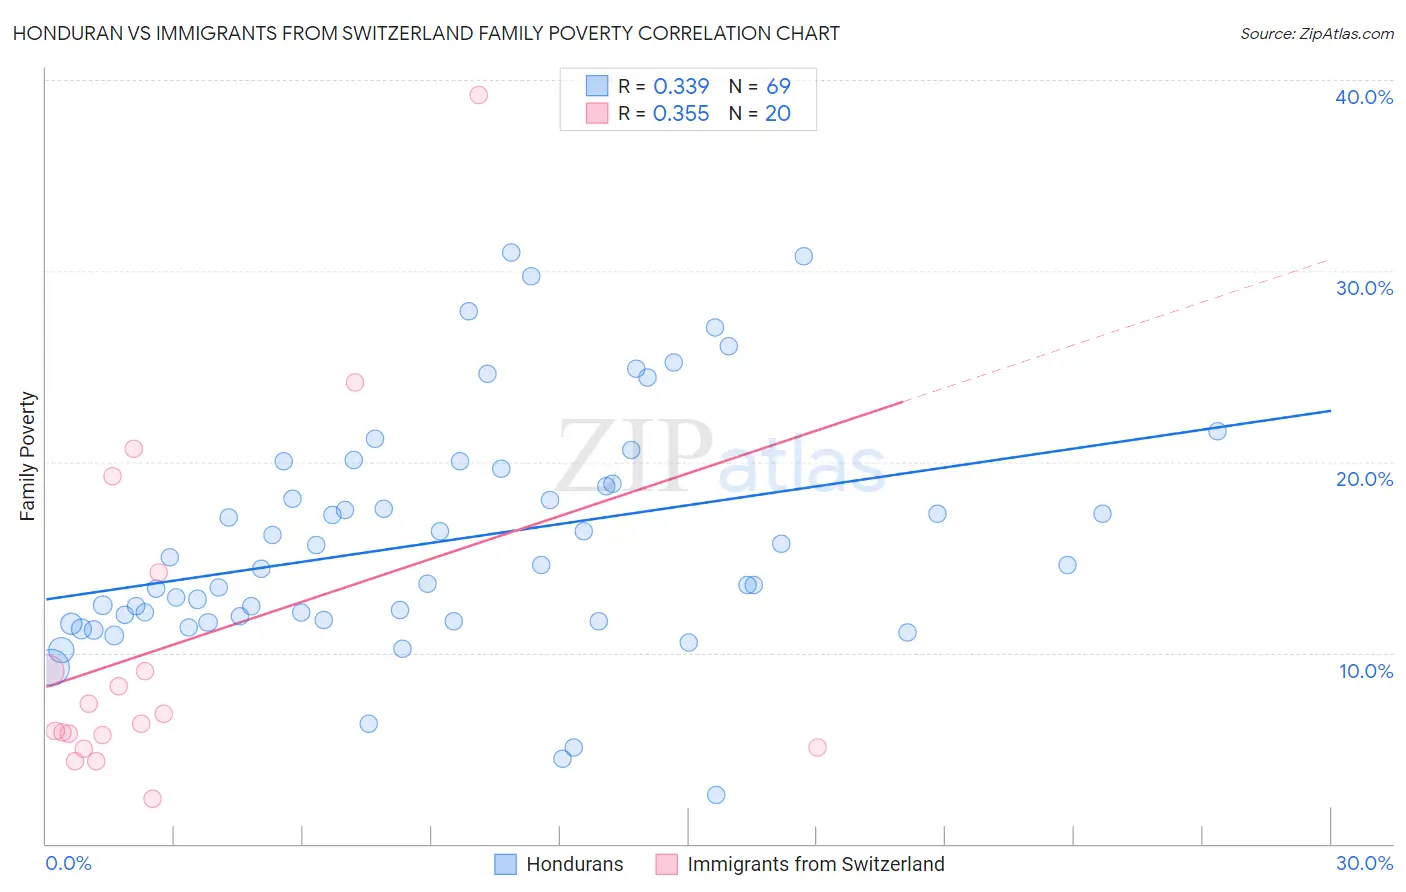
Honduran vs Immigrants from Switzerland Family Poverty Correlation Chart
The statistical analysis conducted on geographies consisting of 357,202,991 people shows a mild positive correlation between the proportion of Hondurans and poverty level among families in the United States with a correlation coefficient (R) of 0.339 and weighted average of 12.4%. Similarly, the statistical analysis conducted on geographies consisting of 147,922,472 people shows a mild positive correlation between the proportion of Immigrants from Switzerland and poverty level among families in the United States with a correlation coefficient (R) of 0.355 and weighted average of 8.1%, a difference of 53.5%.
Family Poverty Correlation Summary
| Measurement | Honduran | Immigrants from Switzerland |
| Minimum | 2.5% | 2.3% |
| Maximum | 31.0% | 39.2% |
| Range | 28.4% | 36.8% |
| Mean | 15.9% | 10.4% |
| Median | 14.6% | 6.5% |
| Interquartile 25% (IQ1) | 11.7% | 5.4% |
| Interquartile 75% (IQ3) | 19.2% | 11.6% |
| Interquartile Range (IQR) | 7.5% | 6.3% |
| Standard Deviation (Sample) | 6.1% | 9.0% |
| Standard Deviation (Population) | 6.1% | 8.8% |
Similar Demographics by Family Poverty
Demographics Similar to Hondurans by Family Poverty
In terms of family poverty, the demographic groups most similar to Hondurans are Immigrants from Grenada (12.4%, a difference of 0.22%), U.S. Virgin Islander (12.4%, a difference of 0.22%), British West Indian (12.4%, a difference of 0.27%), Immigrants from Mexico (12.3%, a difference of 0.74%), and Inupiat (12.5%, a difference of 0.76%).
| Demographics | Rating | Rank | Family Poverty |
| Hispanics or Latinos | 0.0 /100 | #309 | Tragic 12.0% |
| Immigrants | Guatemala | 0.0 /100 | #310 | Tragic 12.0% |
| Ute | 0.0 /100 | #311 | Tragic 12.1% |
| Immigrants | Central America | 0.0 /100 | #312 | Tragic 12.1% |
| Immigrants | Caribbean | 0.0 /100 | #313 | Tragic 12.2% |
| Kiowa | 0.0 /100 | #314 | Tragic 12.2% |
| Immigrants | Mexico | 0.0 /100 | #315 | Tragic 12.3% |
| Hondurans | 0.0 /100 | #316 | Tragic 12.4% |
| Immigrants | Grenada | 0.0 /100 | #317 | Tragic 12.4% |
| U.S. Virgin Islanders | 0.0 /100 | #318 | Tragic 12.4% |
| British West Indians | 0.0 /100 | #319 | Tragic 12.4% |
| Inupiat | 0.0 /100 | #320 | Tragic 12.5% |
| Arapaho | 0.0 /100 | #321 | Tragic 12.7% |
| Immigrants | Honduras | 0.0 /100 | #322 | Tragic 12.7% |
| Menominee | 0.0 /100 | #323 | Tragic 12.7% |
Demographics Similar to Immigrants from Switzerland by Family Poverty
In terms of family poverty, the demographic groups most similar to Immigrants from Switzerland are Immigrants from South Africa (8.1%, a difference of 0.21%), Welsh (8.1%, a difference of 0.28%), New Zealander (8.1%, a difference of 0.35%), Immigrants from Norway (8.1%, a difference of 0.38%), and Immigrants from Indonesia (8.1%, a difference of 0.39%).
| Demographics | Rating | Rank | Family Poverty |
| Immigrants | England | 97.1 /100 | #90 | Exceptional 8.0% |
| Immigrants | Italy | 97.0 /100 | #91 | Exceptional 8.0% |
| Czechoslovakians | 96.8 /100 | #92 | Exceptional 8.0% |
| Tlingit-Haida | 96.7 /100 | #93 | Exceptional 8.0% |
| Immigrants | Pakistan | 96.6 /100 | #94 | Exceptional 8.0% |
| Immigrants | Philippines | 96.5 /100 | #95 | Exceptional 8.0% |
| Immigrants | Turkey | 96.5 /100 | #96 | Exceptional 8.0% |
| Immigrants | Switzerland | 96.1 /100 | #97 | Exceptional 8.1% |
| Immigrants | South Africa | 95.9 /100 | #98 | Exceptional 8.1% |
| Welsh | 95.8 /100 | #99 | Exceptional 8.1% |
| New Zealanders | 95.8 /100 | #100 | Exceptional 8.1% |
| Immigrants | Norway | 95.7 /100 | #101 | Exceptional 8.1% |
| Immigrants | Indonesia | 95.7 /100 | #102 | Exceptional 8.1% |
| Immigrants | Eastern Europe | 95.6 /100 | #103 | Exceptional 8.1% |
| Slavs | 95.6 /100 | #104 | Exceptional 8.1% |