Honduran vs Immigrants from Poland Family Poverty

COMPARE

Honduran
Race
Ancestry
AfghanAfricanAlaska NativeAlaskan AthabascanAlbanianAleutAlsatianAmericanApacheArabArapahoArgentineanArmenianAssyrian/Chaldean/SyriacAustralianAustrianBahamianBangladeshiBarbadianBasqueBelgianBelizeanBermudanBhutaneseBlackfeetBolivianBrazilianBritishBritish West IndianBulgarianBurmeseCajunCambodianCanadianCape VerdeanCarpatho RusynCelticCentral AmericanCentral American IndianCherokeeCheyenneChickasawChileanChineseChippewaChoctawColombianColvilleComancheCosta RicanCreeCreekCroatianCrowCubanCypriotCzechCzechoslovakianDanishDelawareDominicanDutchDutch West IndianEastern EuropeanEcuadorianEgyptianEnglishEstonianEthiopianEuropeanFijianFilipinoFinnishFrenchFrench American IndianFrench CanadianGermanGerman RussianGhanaianGreekGuamanian/ChamorroGuatemalanGuyaneseHaitianHmongHonduranHopiHoumaHungarianIcelanderIndian (Asian)IndonesianInupiatIranianIraqiIrishIroquoisIsraeliItalianJamaicanJapaneseJordanianKenyanKiowaKoreanLaotianLatvianLebaneseLiberianLithuanianLumbeeLuxembourgerMacedonianMalaysianMalteseMarshalleseMenomineeMexicanMexican American IndianMongolianMoroccanNative HawaiianNavajoNepaleseNew ZealanderNicaraguanNigerianNorthern EuropeanNorwegianOkinawanOsageOttawaPaiutePakistaniPalestinianPanamanianParaguayanPennsylvania GermanPeruvianPimaPolishPortuguesePotawatomiPuebloPuerto RicanPuget Sound SalishRomanianRussianSalvadoranSamoanScandinavianScotch-IrishScottishSeminoleSenegaleseSerbianShoshoneSierra LeoneanSiouxSlavicSlovakSloveneSomaliSouth AfricanSouth AmericanSouth American IndianSoviet UnionSpaniardSpanishSpanish AmericanSpanish American IndianSri LankanSubsaharan AfricanSudaneseSwedishSwissSyrianTaiwaneseThaiTlingit-HaidaTohono O'OdhamTonganTrinidadian and TobagonianTsimshianTurkishU.S. Virgin IslanderUgandanUkrainianUruguayanUteVenezuelanVietnameseWelshWest IndianYakamaYaquiYugoslavianYumanYup'ikZimbabwean
Immigration
NonimmigrantsImmigrantsAfghanistanAfricaAlbaniaArgentinaArmeniaAsiaAustraliaAustriaBahamasBangladeshBarbadosBelarusBelgiumBelizeBoliviaBosnia and HerzegovinaBrazilBulgariaBurma/MyanmarCabo VerdeCambodiaCameroonCanadaCaribbeanCentral AmericaChileChinaColombiaCongoCosta RicaCroatiaCubaCzechoslovakiaDenmarkDominicaDominican RepublicEastern AfricaEastern AsiaEastern EuropeEcuadorEgyptEl SalvadorEnglandEritreaEthiopiaEuropeFijiFranceGermanyGhanaGreeceGrenadaGuatemalaGuyanaHaitiHondurasHong KongHungaryIndiaIndonesiaIranIraqIrelandIsraelItalyJamaicaJapanJordanKazakhstanKenyaKoreaKuwaitLaosLatin AmericaLatviaLebanonLiberiaLithuaniaMalaysiaMexicoMicronesiaMiddle AfricaMoldovaMoroccoNepalNetherlandsNicaraguaNigeriaNorth AmericaNorth MacedoniaNorthern AfricaNorthern EuropeNorwayOceaniaPakistanPanamaPeruPhilippinesPortugalRomaniaRussiaSaudi ArabiaScotlandSenegalSerbiaSierra LeoneSingaporeSomaliaSouth AfricaSouth AmericaSouth Central AsiaSouth Eastern AsiaSouthern EuropeSpainSri LankaSt. Vincent and the GrenadinesSudanSwedenSwitzerlandSyriaTaiwanThailandTrinidad and TobagoTurkeyUgandaUkraineUruguayUzbekistanVenezuelaVietnamWest IndiesWestern AfricaWestern AsiaWestern EuropeYemenZaireZimbabweAzores
Immigrants from Poland
Race
Ancestry
AfghanAfricanAlaska NativeAlaskan AthabascanAlbanianAleutAlsatianAmericanApacheArabArapahoArgentineanArmenianAssyrian/Chaldean/SyriacAustralianAustrianBahamianBangladeshiBarbadianBasqueBelgianBelizeanBermudanBhutaneseBlackfeetBolivianBrazilianBritishBritish West IndianBulgarianBurmeseCajunCambodianCanadianCape VerdeanCarpatho RusynCelticCentral AmericanCentral American IndianCherokeeCheyenneChickasawChileanChineseChippewaChoctawColombianColvilleComancheCosta RicanCreeCreekCroatianCrowCubanCypriotCzechCzechoslovakianDanishDelawareDominicanDutchDutch West IndianEastern EuropeanEcuadorianEgyptianEnglishEstonianEthiopianEuropeanFijianFilipinoFinnishFrenchFrench American IndianFrench CanadianGermanGerman RussianGhanaianGreekGuamanian/ChamorroGuatemalanGuyaneseHaitianHmongHopiHoumaHungarianIcelanderIndian (Asian)IndonesianInupiatIranianIraqiIrishIroquoisIsraeliItalianJamaicanJapaneseJordanianKenyanKiowaKoreanLaotianLatvianLebaneseLiberianLithuanianLumbeeLuxembourgerMacedonianMalaysianMalteseMarshalleseMenomineeMexicanMexican American IndianMongolianMoroccanNative HawaiianNavajoNepaleseNew ZealanderNicaraguanNigerianNorthern EuropeanNorwegianOkinawanOsageOttawaPaiutePakistaniPalestinianPanamanianParaguayanPennsylvania GermanPeruvianPimaPolishPortuguesePotawatomiPuebloPuerto RicanPuget Sound SalishRomanianRussianSalvadoranSamoanScandinavianScotch-IrishScottishSeminoleSenegaleseSerbianShoshoneSierra LeoneanSiouxSlavicSlovakSloveneSomaliSouth AfricanSouth AmericanSouth American IndianSoviet UnionSpaniardSpanishSpanish AmericanSpanish American IndianSri LankanSubsaharan AfricanSudaneseSwedishSwissSyrianTaiwaneseThaiTlingit-HaidaTohono O'OdhamTonganTrinidadian and TobagonianTsimshianTurkishU.S. Virgin IslanderUgandanUkrainianUruguayanUteVenezuelanVietnameseWelshWest IndianYakamaYaquiYugoslavianYumanYup'ikZimbabwean
Immigration
NonimmigrantsImmigrantsAfghanistanAfricaAlbaniaArgentinaArmeniaAsiaAustraliaAustriaBahamasBangladeshBarbadosBelarusBelgiumBelizeBoliviaBosnia and HerzegovinaBrazilBulgariaBurma/MyanmarCabo VerdeCambodiaCameroonCanadaCaribbeanCentral AmericaChileChinaColombiaCongoCosta RicaCroatiaCubaCzechoslovakiaDenmarkDominicaDominican RepublicEastern AfricaEastern AsiaEastern EuropeEcuadorEgyptEl SalvadorEnglandEritreaEthiopiaEuropeFijiFranceGermanyGhanaGreeceGrenadaGuatemalaGuyanaHaitiHondurasHong KongHungaryIndiaIndonesiaIranIraqIrelandIsraelItalyJamaicaJapanJordanKazakhstanKenyaKoreaKuwaitLaosLatin AmericaLatviaLebanonLiberiaLithuaniaMalaysiaMexicoMicronesiaMiddle AfricaMoldovaMoroccoNepalNetherlandsNicaraguaNigeriaNorth AmericaNorth MacedoniaNorthern AfricaNorthern EuropeNorwayOceaniaPakistanPanamaPeruPhilippinesPolandPortugalRomaniaRussiaSaudi ArabiaScotlandSenegalSerbiaSierra LeoneSingaporeSomaliaSouth AfricaSouth AmericaSouth Central AsiaSouth Eastern AsiaSouthern EuropeSpainSri LankaSt. Vincent and the GrenadinesSudanSwedenSwitzerlandSyriaTaiwanThailandTrinidad and TobagoTurkeyUgandaUkraineUruguayUzbekistanVenezuelaVietnamWest IndiesWestern AfricaWestern AsiaWestern EuropeYemenZaireZimbabweAzores
Family Poverty
Income
Poverty
Unemployment
Labor Participation
Family Structure
Vehicle Availability
Education Level
Disability

Family Poverty Comparison

Hondurans

Immigrants from Poland

Tragic
Exceptional
12.4%
FAMILY POVERTY
0.0/ 100
METRIC RATING
316th/ 347
METRIC RANK
7.9%
FAMILY POVERTY
97.8/ 100
METRIC RATING
82nd/ 347
METRIC RANK

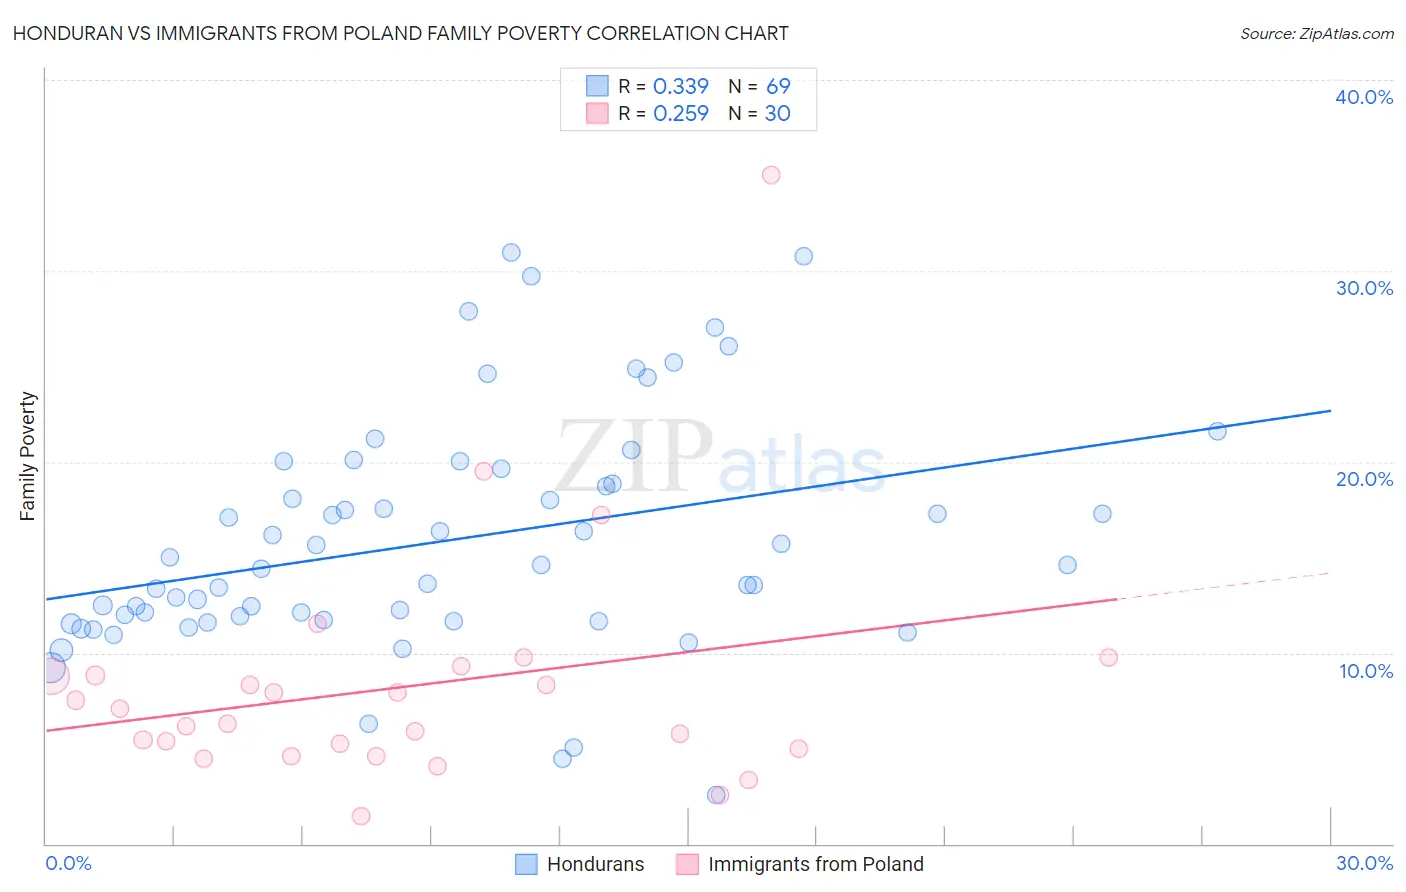
Honduran vs Immigrants from Poland Family Poverty Correlation Chart

The statistical analysis conducted on geographies consisting of 357,202,991 people shows a mild positive correlation between the proportion of Hondurans and poverty level among families in the United States with a correlation coefficient (R) of 0.339 and weighted average of 12.4%. Similarly, the statistical analysis conducted on geographies consisting of 304,048,718 people shows a weak positive correlation between the proportion of Immigrants from Poland and poverty level among families in the United States with a correlation coefficient (R) of 0.259 and weighted average of 7.9%, a difference of 56.8%.
Honduran vs Immigrants from Poland Family Poverty

Family Poverty Correlation Summary

MeasurementHonduranImmigrants from Poland
Minimum2.5%1.5%
Maximum31.0%35.0%
Range28.4%33.5%
Mean15.9%8.2%
Median14.6%6.7%
Interquartile 25% (IQ1)11.7%5.0%
Interquartile 75% (IQ3)19.2%8.8%
Interquartile Range (IQR)7.5%3.8%
Standard Deviation (Sample)6.1%6.3%
Standard Deviation (Population)6.1%6.2%

Similar Demographics by Family Poverty

Demographics Similar to Hondurans by Family Poverty

In terms of family poverty, the demographic groups most similar to Hondurans are Immigrants from Grenada (12.4%, a difference of 0.22%), U.S. Virgin Islander (12.4%, a difference of 0.22%), British West Indian (12.4%, a difference of 0.27%), Immigrants from Mexico (12.3%, a difference of 0.74%), and Inupiat (12.5%, a difference of 0.76%).
DemographicsRating | RankFamily Poverty
Hispanics or Latinos
0.0
/100
|
#309
Tragic
12.0%
Immigrants | Guatemala
0.0
/100
|
#310
Tragic
12.0%
Ute
0.0
/100
|
#311
Tragic
12.1%
Immigrants | Central America
0.0
/100
|
#312
Tragic
12.1%
Immigrants | Caribbean
0.0
/100
|
#313
Tragic
12.2%
Kiowa
0.0
/100
|
#314
Tragic
12.2%
Immigrants | Mexico
0.0
/100
|
#315
Tragic
12.3%
Hondurans
0.0
/100
|
#316
Tragic
12.4%
Immigrants | Grenada
0.0
/100
|
#317
Tragic
12.4%
U.S. Virgin Islanders
0.0
/100
|
#318
Tragic
12.4%
British West Indians
0.0
/100
|
#319
Tragic
12.4%
Inupiat
0.0
/100
|
#320
Tragic
12.5%
Arapaho
0.0
/100
|
#321
Tragic
12.7%
Immigrants | Honduras
0.0
/100
|
#322
Tragic
12.7%
Menominee
0.0
/100
|
#323
Tragic
12.7%

Demographics Similar to Immigrants from Poland by Family Poverty

In terms of family poverty, the demographic groups most similar to Immigrants from Poland are English (7.9%, a difference of 0.030%), Irish (7.9%, a difference of 0.030%), Immigrants from Europe (7.9%, a difference of 0.090%), Immigrants from North America (7.9%, a difference of 0.17%), and Slovak (7.9%, a difference of 0.18%).
DemographicsRating | RankFamily Poverty
Immigrants | Croatia
98.1
/100
|
#75
Exceptional
7.8%
Immigrants | Latvia
98.0
/100
|
#76
Exceptional
7.9%
Ukrainians
98.0
/100
|
#77
Exceptional
7.9%
Immigrants | North America
97.9
/100
|
#78
Exceptional
7.9%
Immigrants | Europe
97.8
/100
|
#79
Exceptional
7.9%
English
97.8
/100
|
#80
Exceptional
7.9%
Irish
97.8
/100
|
#81
Exceptional
7.9%
Immigrants | Poland
97.8
/100
|
#82
Exceptional
7.9%
Slovaks
97.7
/100
|
#83
Exceptional
7.9%
British
97.5
/100
|
#84
Exceptional
7.9%
Immigrants | Asia
97.4
/100
|
#85
Exceptional
7.9%
Scottish
97.3
/100
|
#86
Exceptional
7.9%
Belgians
97.3
/100
|
#87
Exceptional
8.0%
Serbians
97.2
/100
|
#88
Exceptional
8.0%
Immigrants | Denmark
97.1
/100
|
#89
Exceptional
8.0%