Hmong vs Immigrants from Micronesia Female Poverty
COMPARE
Hmong
Immigrants from Micronesia
Female Poverty
Female Poverty Comparison
Hmong
Immigrants from Micronesia
13.9%
FEMALE POVERTY
21.1/ 100
METRIC RATING
202nd/ 347
METRIC RANK
14.6%
FEMALE POVERTY
2.8/ 100
METRIC RATING
225th/ 347
METRIC RANK
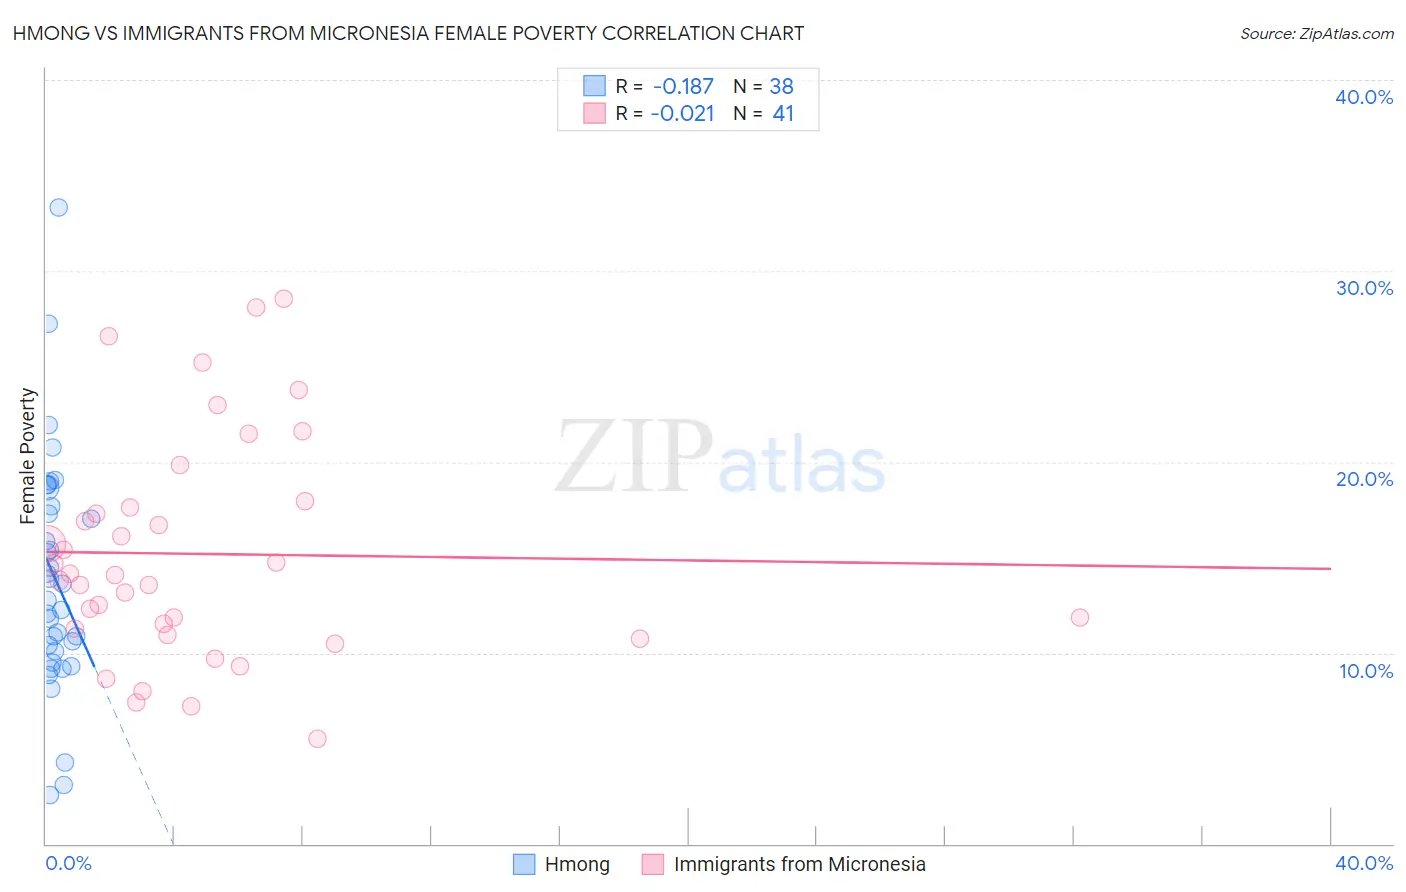
Hmong vs Immigrants from Micronesia Female Poverty Correlation Chart
The statistical analysis conducted on geographies consisting of 24,669,739 people shows a poor negative correlation between the proportion of Hmong and poverty level among females in the United States with a correlation coefficient (R) of -0.187 and weighted average of 13.9%. Similarly, the statistical analysis conducted on geographies consisting of 61,598,516 people shows no correlation between the proportion of Immigrants from Micronesia and poverty level among females in the United States with a correlation coefficient (R) of -0.021 and weighted average of 14.6%, a difference of 5.2%.
Female Poverty Correlation Summary
| Measurement | Hmong | Immigrants from Micronesia |
| Minimum | 2.5% | 5.5% |
| Maximum | 33.3% | 28.6% |
| Range | 30.8% | 23.0% |
| Mean | 13.9% | 15.2% |
| Median | 13.2% | 14.1% |
| Interquartile 25% (IQ1) | 10.1% | 11.1% |
| Interquartile 75% (IQ3) | 17.7% | 17.8% |
| Interquartile Range (IQR) | 7.6% | 6.7% |
| Standard Deviation (Sample) | 6.1% | 5.8% |
| Standard Deviation (Population) | 6.1% | 5.7% |
Similar Demographics by Female Poverty
Demographics Similar to Hmong by Female Poverty
In terms of female poverty, the demographic groups most similar to Hmong are Immigrants from Kenya (13.9%, a difference of 0.010%), Spanish (13.9%, a difference of 0.050%), Immigrants from Western Asia (13.9%, a difference of 0.050%), Spaniard (13.9%, a difference of 0.32%), and Immigrants from Lebanon (13.8%, a difference of 0.60%).
| Demographics | Rating | Rank | Female Poverty |
| Immigrants | South America | 30.6 /100 | #195 | Fair 13.7% |
| South American Indians | 28.9 /100 | #196 | Fair 13.7% |
| Arabs | 28.6 /100 | #197 | Fair 13.7% |
| Immigrants | Uganda | 28.5 /100 | #198 | Fair 13.7% |
| Immigrants | Lebanon | 25.6 /100 | #199 | Fair 13.8% |
| Spanish | 21.4 /100 | #200 | Fair 13.9% |
| Immigrants | Kenya | 21.1 /100 | #201 | Fair 13.9% |
| Hmong | 21.1 /100 | #202 | Fair 13.9% |
| Immigrants | Western Asia | 20.7 /100 | #203 | Fair 13.9% |
| Spaniards | 18.9 /100 | #204 | Poor 13.9% |
| Ugandans | 15.4 /100 | #205 | Poor 14.0% |
| Immigrants | Uruguay | 14.0 /100 | #206 | Poor 14.0% |
| Immigrants | Eastern Africa | 9.0 /100 | #207 | Tragic 14.2% |
| Immigrants | Azores | 7.9 /100 | #208 | Tragic 14.2% |
| Panamanians | 7.7 /100 | #209 | Tragic 14.2% |
Demographics Similar to Immigrants from Micronesia by Female Poverty
In terms of female poverty, the demographic groups most similar to Immigrants from Micronesia are American (14.6%, a difference of 0.0%), Immigrants from Eritrea (14.6%, a difference of 0.33%), Immigrants from Africa (14.5%, a difference of 0.40%), Nonimmigrants (14.5%, a difference of 0.63%), and Immigrants from Nigeria (14.7%, a difference of 0.64%).
| Demographics | Rating | Rank | Female Poverty |
| Immigrants | Uzbekistan | 4.4 /100 | #218 | Tragic 14.4% |
| Japanese | 4.1 /100 | #219 | Tragic 14.5% |
| Alsatians | 4.0 /100 | #220 | Tragic 14.5% |
| Immigrants | Cambodia | 3.7 /100 | #221 | Tragic 14.5% |
| Immigrants | Nonimmigrants | 3.7 /100 | #222 | Tragic 14.5% |
| Immigrants | Africa | 3.3 /100 | #223 | Tragic 14.5% |
| Americans | 2.8 /100 | #224 | Tragic 14.6% |
| Immigrants | Micronesia | 2.8 /100 | #225 | Tragic 14.6% |
| Immigrants | Eritrea | 2.4 /100 | #226 | Tragic 14.6% |
| Immigrants | Nigeria | 2.1 /100 | #227 | Tragic 14.7% |
| German Russians | 2.0 /100 | #228 | Tragic 14.7% |
| Ghanaians | 1.9 /100 | #229 | Tragic 14.7% |
| Alaska Natives | 1.8 /100 | #230 | Tragic 14.7% |
| Nigerians | 1.7 /100 | #231 | Tragic 14.8% |
| Osage | 1.5 /100 | #232 | Tragic 14.8% |