Hawaiian vs Indonesian Family Poverty
COMPARE
Hawaiian
Indonesian
Family Poverty
Family Poverty Comparison
Hawaiians
Indonesians
9.0%
FAMILY POVERTY
47.2/ 100
METRIC RATING
177th/ 347
METRIC RANK
11.3%
FAMILY POVERTY
0.0/ 100
METRIC RATING
283rd/ 347
METRIC RANK
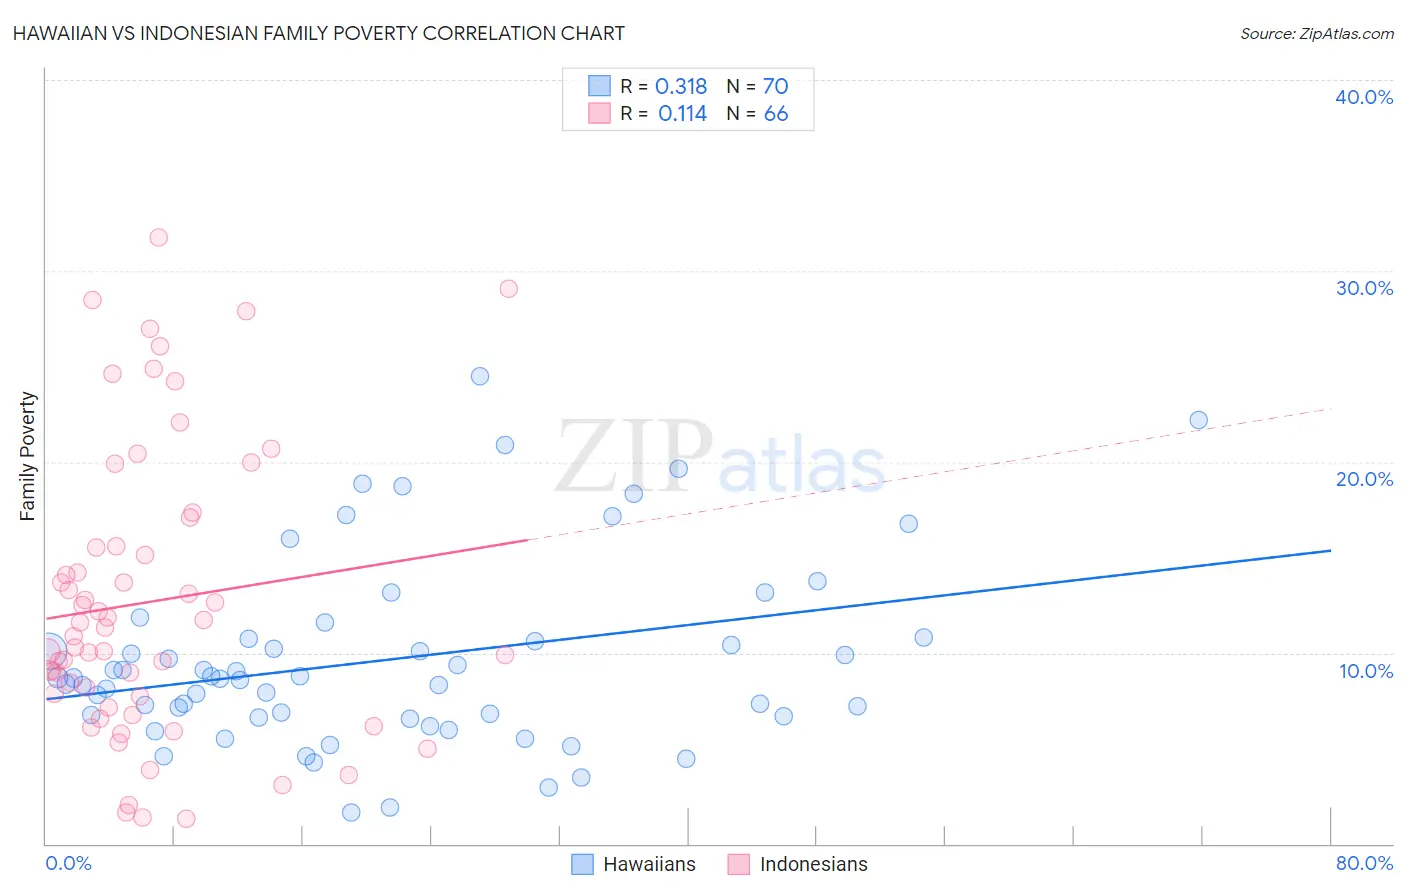
Hawaiian vs Indonesian Family Poverty Correlation Chart
The statistical analysis conducted on geographies consisting of 327,007,125 people shows a mild positive correlation between the proportion of Hawaiians and poverty level among families in the United States with a correlation coefficient (R) of 0.318 and weighted average of 9.0%. Similarly, the statistical analysis conducted on geographies consisting of 162,562,549 people shows a poor positive correlation between the proportion of Indonesians and poverty level among families in the United States with a correlation coefficient (R) of 0.114 and weighted average of 11.3%, a difference of 25.3%.
Family Poverty Correlation Summary
| Measurement | Hawaiian | Indonesian |
| Minimum | 1.6% | 1.3% |
| Maximum | 24.5% | 31.7% |
| Range | 22.9% | 30.4% |
| Mean | 9.6% | 12.7% |
| Median | 8.7% | 11.1% |
| Interquartile 25% (IQ1) | 6.7% | 7.7% |
| Interquartile 75% (IQ3) | 10.8% | 15.6% |
| Interquartile Range (IQR) | 4.1% | 7.9% |
| Standard Deviation (Sample) | 4.9% | 7.5% |
| Standard Deviation (Population) | 4.8% | 7.5% |
Similar Demographics by Family Poverty
Demographics Similar to Hawaiians by Family Poverty
In terms of family poverty, the demographic groups most similar to Hawaiians are Immigrants from Cameroon (9.0%, a difference of 0.010%), Immigrants from Syria (9.0%, a difference of 0.030%), Costa Rican (9.0%, a difference of 0.27%), Immigrants from Albania (9.0%, a difference of 0.36%), and Immigrants from Iraq (9.1%, a difference of 0.38%).
| Demographics | Rating | Rank | Family Poverty |
| Kenyans | 58.2 /100 | #170 | Average 8.9% |
| Lebanese | 57.6 /100 | #171 | Average 8.9% |
| Immigrants | Peru | 57.5 /100 | #172 | Average 8.9% |
| Immigrants | Fiji | 56.4 /100 | #173 | Average 8.9% |
| Immigrants | Albania | 50.0 /100 | #174 | Average 9.0% |
| Costa Ricans | 49.3 /100 | #175 | Average 9.0% |
| Immigrants | Syria | 47.5 /100 | #176 | Average 9.0% |
| Hawaiians | 47.2 /100 | #177 | Average 9.0% |
| Immigrants | Cameroon | 47.1 /100 | #178 | Average 9.0% |
| Immigrants | Iraq | 44.4 /100 | #179 | Average 9.1% |
| Immigrants | Uganda | 43.4 /100 | #180 | Average 9.1% |
| Hmong | 40.2 /100 | #181 | Average 9.1% |
| Immigrants | Morocco | 40.2 /100 | #182 | Average 9.1% |
| Uruguayans | 39.2 /100 | #183 | Fair 9.1% |
| South American Indians | 38.7 /100 | #184 | Fair 9.1% |
Demographics Similar to Indonesians by Family Poverty
In terms of family poverty, the demographic groups most similar to Indonesians are Immigrants from Cuba (11.3%, a difference of 0.040%), Yaqui (11.3%, a difference of 0.12%), Barbadian (11.3%, a difference of 0.20%), Immigrants from West Indies (11.3%, a difference of 0.30%), and Belizean (11.3%, a difference of 0.57%).
| Demographics | Rating | Rank | Family Poverty |
| Immigrants | Guyana | 0.1 /100 | #276 | Tragic 11.2% |
| Chippewa | 0.1 /100 | #277 | Tragic 11.2% |
| Guyanese | 0.1 /100 | #278 | Tragic 11.2% |
| Blackfeet | 0.0 /100 | #279 | Tragic 11.3% |
| Belizeans | 0.0 /100 | #280 | Tragic 11.3% |
| Immigrants | West Indies | 0.0 /100 | #281 | Tragic 11.3% |
| Immigrants | Cuba | 0.0 /100 | #282 | Tragic 11.3% |
| Indonesians | 0.0 /100 | #283 | Tragic 11.3% |
| Yaqui | 0.0 /100 | #284 | Tragic 11.3% |
| Barbadians | 0.0 /100 | #285 | Tragic 11.3% |
| Senegalese | 0.0 /100 | #286 | Tragic 11.5% |
| Vietnamese | 0.0 /100 | #287 | Tragic 11.5% |
| Immigrants | Belize | 0.0 /100 | #288 | Tragic 11.5% |
| Immigrants | Barbados | 0.0 /100 | #289 | Tragic 11.5% |
| West Indians | 0.0 /100 | #290 | Tragic 11.5% |