Hawaiian vs Estonian Family Poverty
COMPARE
Hawaiian
Estonian
Family Poverty
Family Poverty Comparison
Hawaiians
Estonians
9.0%
FAMILY POVERTY
47.2/ 100
METRIC RATING
177th/ 347
METRIC RANK
7.5%
FAMILY POVERTY
99.4/ 100
METRIC RATING
37th/ 347
METRIC RANK
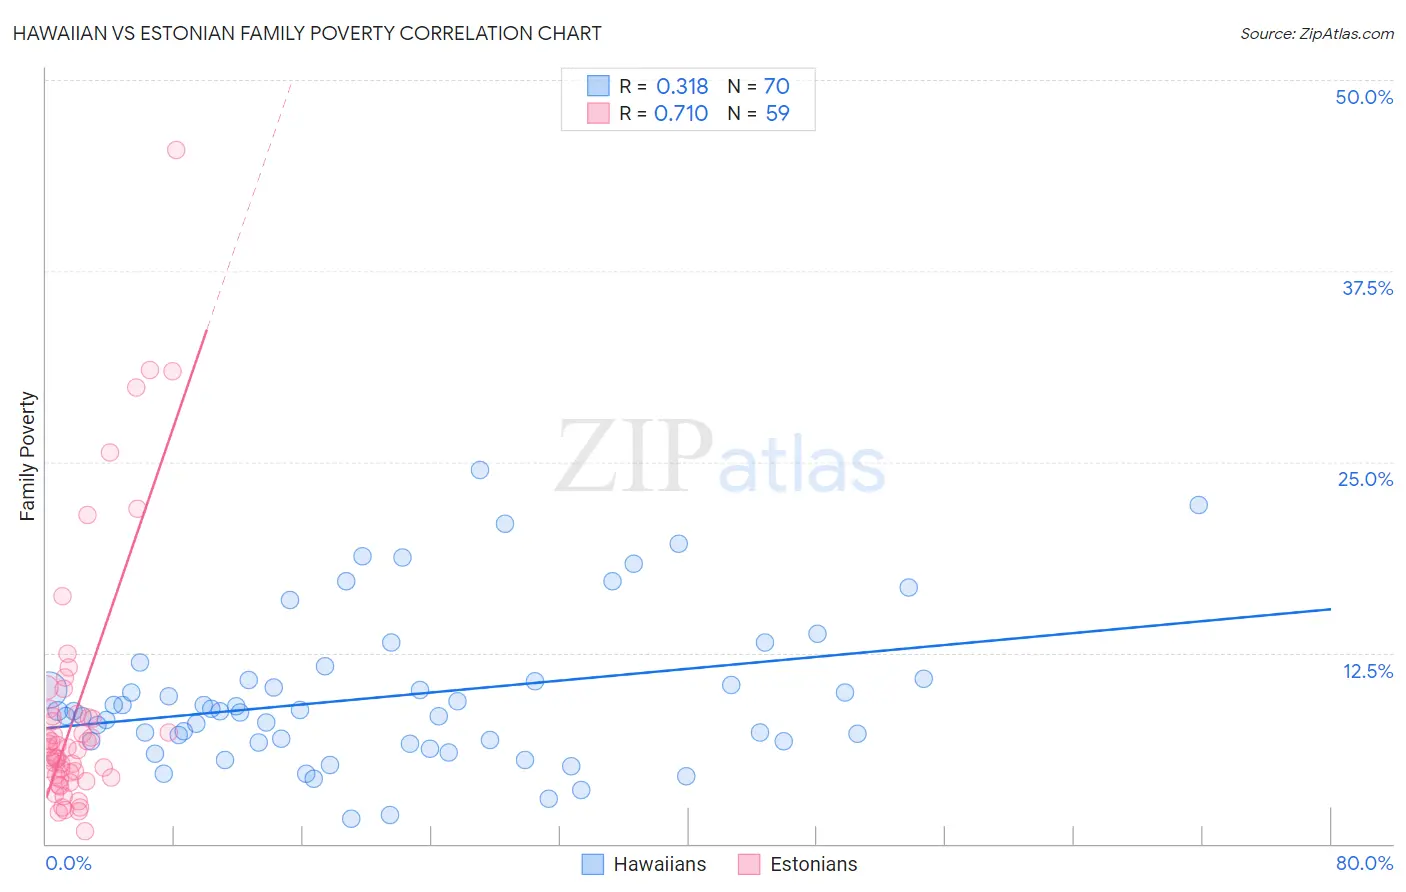
Hawaiian vs Estonian Family Poverty Correlation Chart
The statistical analysis conducted on geographies consisting of 327,007,125 people shows a mild positive correlation between the proportion of Hawaiians and poverty level among families in the United States with a correlation coefficient (R) of 0.318 and weighted average of 9.0%. Similarly, the statistical analysis conducted on geographies consisting of 123,321,798 people shows a strong positive correlation between the proportion of Estonians and poverty level among families in the United States with a correlation coefficient (R) of 0.710 and weighted average of 7.5%, a difference of 20.2%.
Family Poverty Correlation Summary
| Measurement | Hawaiian | Estonian |
| Minimum | 1.6% | 0.86% |
| Maximum | 24.5% | 45.5% |
| Range | 22.9% | 44.6% |
| Mean | 9.6% | 8.8% |
| Median | 8.7% | 6.3% |
| Interquartile 25% (IQ1) | 6.7% | 4.3% |
| Interquartile 75% (IQ3) | 10.8% | 8.6% |
| Interquartile Range (IQR) | 4.1% | 4.3% |
| Standard Deviation (Sample) | 4.9% | 8.5% |
| Standard Deviation (Population) | 4.8% | 8.4% |
Similar Demographics by Family Poverty
Demographics Similar to Hawaiians by Family Poverty
In terms of family poverty, the demographic groups most similar to Hawaiians are Immigrants from Cameroon (9.0%, a difference of 0.010%), Immigrants from Syria (9.0%, a difference of 0.030%), Costa Rican (9.0%, a difference of 0.27%), Immigrants from Albania (9.0%, a difference of 0.36%), and Immigrants from Iraq (9.1%, a difference of 0.38%).
| Demographics | Rating | Rank | Family Poverty |
| Kenyans | 58.2 /100 | #170 | Average 8.9% |
| Lebanese | 57.6 /100 | #171 | Average 8.9% |
| Immigrants | Peru | 57.5 /100 | #172 | Average 8.9% |
| Immigrants | Fiji | 56.4 /100 | #173 | Average 8.9% |
| Immigrants | Albania | 50.0 /100 | #174 | Average 9.0% |
| Costa Ricans | 49.3 /100 | #175 | Average 9.0% |
| Immigrants | Syria | 47.5 /100 | #176 | Average 9.0% |
| Hawaiians | 47.2 /100 | #177 | Average 9.0% |
| Immigrants | Cameroon | 47.1 /100 | #178 | Average 9.0% |
| Immigrants | Iraq | 44.4 /100 | #179 | Average 9.1% |
| Immigrants | Uganda | 43.4 /100 | #180 | Average 9.1% |
| Hmong | 40.2 /100 | #181 | Average 9.1% |
| Immigrants | Morocco | 40.2 /100 | #182 | Average 9.1% |
| Uruguayans | 39.2 /100 | #183 | Fair 9.1% |
| South American Indians | 38.7 /100 | #184 | Fair 9.1% |
Demographics Similar to Estonians by Family Poverty
In terms of family poverty, the demographic groups most similar to Estonians are Turkish (7.5%, a difference of 0.17%), Greek (7.5%, a difference of 0.18%), Bolivian (7.5%, a difference of 0.24%), Carpatho Rusyn (7.5%, a difference of 0.31%), and Slovene (7.5%, a difference of 0.34%).
| Demographics | Rating | Rank | Family Poverty |
| Italians | 99.6 /100 | #30 | Exceptional 7.4% |
| Czechs | 99.6 /100 | #31 | Exceptional 7.4% |
| Poles | 99.5 /100 | #32 | Exceptional 7.4% |
| Immigrants | Japan | 99.5 /100 | #33 | Exceptional 7.4% |
| Russians | 99.5 /100 | #34 | Exceptional 7.5% |
| Greeks | 99.4 /100 | #35 | Exceptional 7.5% |
| Turks | 99.4 /100 | #36 | Exceptional 7.5% |
| Estonians | 99.4 /100 | #37 | Exceptional 7.5% |
| Bolivians | 99.3 /100 | #38 | Exceptional 7.5% |
| Carpatho Rusyns | 99.3 /100 | #39 | Exceptional 7.5% |
| Slovenes | 99.3 /100 | #40 | Exceptional 7.5% |
| Immigrants | Australia | 99.2 /100 | #41 | Exceptional 7.6% |
| Scandinavians | 99.1 /100 | #42 | Exceptional 7.6% |
| Immigrants | Austria | 99.1 /100 | #43 | Exceptional 7.6% |
| Germans | 99.0 /100 | #44 | Exceptional 7.7% |