Hawaiian vs Albanian Single Father Poverty
COMPARE
Hawaiian
Albanian
Single Father Poverty
Single Father Poverty Comparison
Hawaiians
Albanians
15.1%
SINGLE FATHER POVERTY
99.9/ 100
METRIC RATING
58th/ 347
METRIC RANK
17.2%
SINGLE FATHER POVERTY
0.7/ 100
METRIC RATING
258th/ 347
METRIC RANK
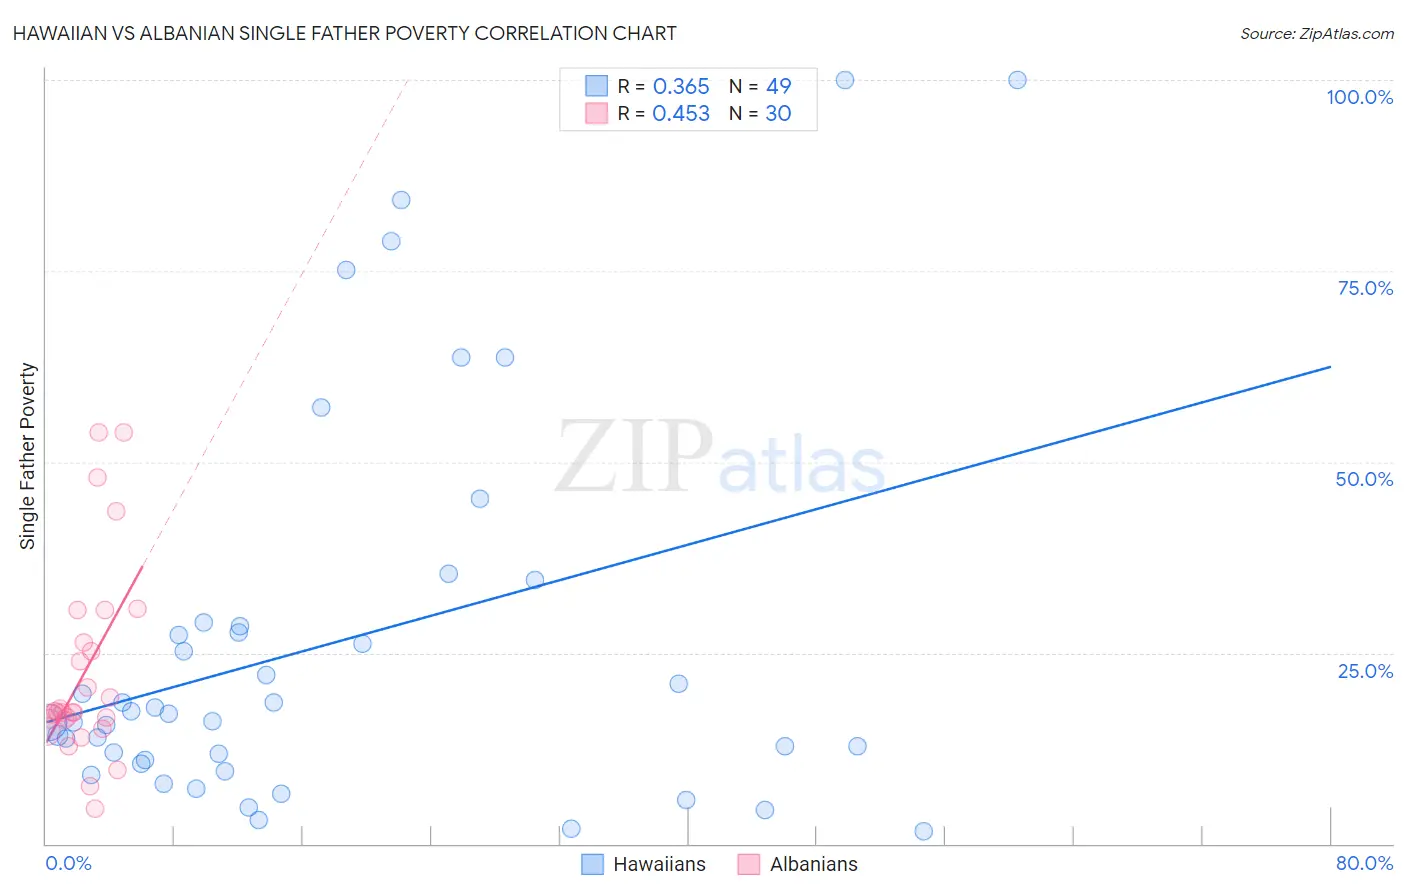
Hawaiian vs Albanian Single Father Poverty Correlation Chart
The statistical analysis conducted on geographies consisting of 272,607,469 people shows a mild positive correlation between the proportion of Hawaiians and poverty level among single fathers in the United States with a correlation coefficient (R) of 0.365 and weighted average of 15.1%. Similarly, the statistical analysis conducted on geographies consisting of 159,395,060 people shows a moderate positive correlation between the proportion of Albanians and poverty level among single fathers in the United States with a correlation coefficient (R) of 0.453 and weighted average of 17.2%, a difference of 14.0%.
Single Father Poverty Correlation Summary
| Measurement | Hawaiian | Albanian |
| Minimum | 1.7% | 4.7% |
| Maximum | 100.0% | 53.8% |
| Range | 98.3% | 49.2% |
| Mean | 26.3% | 22.4% |
| Median | 17.0% | 17.2% |
| Interquartile 25% (IQ1) | 10.7% | 16.3% |
| Interquartile 75% (IQ3) | 28.7% | 26.4% |
| Interquartile Range (IQR) | 18.0% | 10.1% |
| Standard Deviation (Sample) | 25.4% | 12.6% |
| Standard Deviation (Population) | 25.2% | 12.4% |
Similar Demographics by Single Father Poverty
Demographics Similar to Hawaiians by Single Father Poverty
In terms of single father poverty, the demographic groups most similar to Hawaiians are Laotian (15.1%, a difference of 0.060%), Guamanian/Chamorro (15.1%, a difference of 0.10%), Immigrants from Laos (15.1%, a difference of 0.14%), Immigrants from Bulgaria (15.0%, a difference of 0.42%), and Immigrants from Uzbekistan (15.0%, a difference of 0.47%).
| Demographics | Rating | Rank | Single Father Poverty |
| Immigrants | Pakistan | 99.9 /100 | #51 | Exceptional 15.0% |
| Immigrants | El Salvador | 99.9 /100 | #52 | Exceptional 15.0% |
| Immigrants | Kenya | 99.9 /100 | #53 | Exceptional 15.0% |
| Immigrants | Uzbekistan | 99.9 /100 | #54 | Exceptional 15.0% |
| Immigrants | Bulgaria | 99.9 /100 | #55 | Exceptional 15.0% |
| Immigrants | Laos | 99.9 /100 | #56 | Exceptional 15.1% |
| Laotians | 99.9 /100 | #57 | Exceptional 15.1% |
| Hawaiians | 99.9 /100 | #58 | Exceptional 15.1% |
| Guamanians/Chamorros | 99.9 /100 | #59 | Exceptional 15.1% |
| Puget Sound Salish | 99.8 /100 | #60 | Exceptional 15.2% |
| Immigrants | Bosnia and Herzegovina | 99.8 /100 | #61 | Exceptional 15.2% |
| Immigrants | Armenia | 99.8 /100 | #62 | Exceptional 15.2% |
| Immigrants | Sweden | 99.8 /100 | #63 | Exceptional 15.2% |
| Bangladeshis | 99.8 /100 | #64 | Exceptional 15.2% |
| Immigrants | Malaysia | 99.8 /100 | #65 | Exceptional 15.2% |
Demographics Similar to Albanians by Single Father Poverty
In terms of single father poverty, the demographic groups most similar to Albanians are Immigrants from Albania (17.2%, a difference of 0.020%), Immigrants from Jamaica (17.2%, a difference of 0.040%), Immigrants from Haiti (17.2%, a difference of 0.10%), Sierra Leonean (17.2%, a difference of 0.11%), and Spaniard (17.2%, a difference of 0.18%).
| Demographics | Rating | Rank | Single Father Poverty |
| Luxembourgers | 1.1 /100 | #251 | Tragic 17.1% |
| Croatians | 1.0 /100 | #252 | Tragic 17.1% |
| Cree | 1.0 /100 | #253 | Tragic 17.1% |
| Immigrants | Honduras | 0.9 /100 | #254 | Tragic 17.1% |
| Sierra Leoneans | 0.8 /100 | #255 | Tragic 17.2% |
| Immigrants | Haiti | 0.8 /100 | #256 | Tragic 17.2% |
| Immigrants | Albania | 0.7 /100 | #257 | Tragic 17.2% |
| Albanians | 0.7 /100 | #258 | Tragic 17.2% |
| Immigrants | Jamaica | 0.7 /100 | #259 | Tragic 17.2% |
| Spaniards | 0.6 /100 | #260 | Tragic 17.2% |
| Swiss | 0.5 /100 | #261 | Tragic 17.3% |
| Immigrants | Zaire | 0.4 /100 | #262 | Tragic 17.3% |
| Lithuanians | 0.4 /100 | #263 | Tragic 17.3% |
| Slovenes | 0.3 /100 | #264 | Tragic 17.3% |
| Poles | 0.3 /100 | #265 | Tragic 17.3% |