Hawaiian vs Albanian Householder Income Under 25 years
COMPARE
Hawaiian
Albanian
Householder Income Under 25 years
Householder Income Under 25 years Comparison
Hawaiians
Albanians
$53,078
HOUSEHOLDER INCOME UNDER 25 YEARS
89.8/ 100
METRIC RATING
140th/ 347
METRIC RANK
$53,794
HOUSEHOLDER INCOME UNDER 25 YEARS
98.1/ 100
METRIC RATING
106th/ 347
METRIC RANK
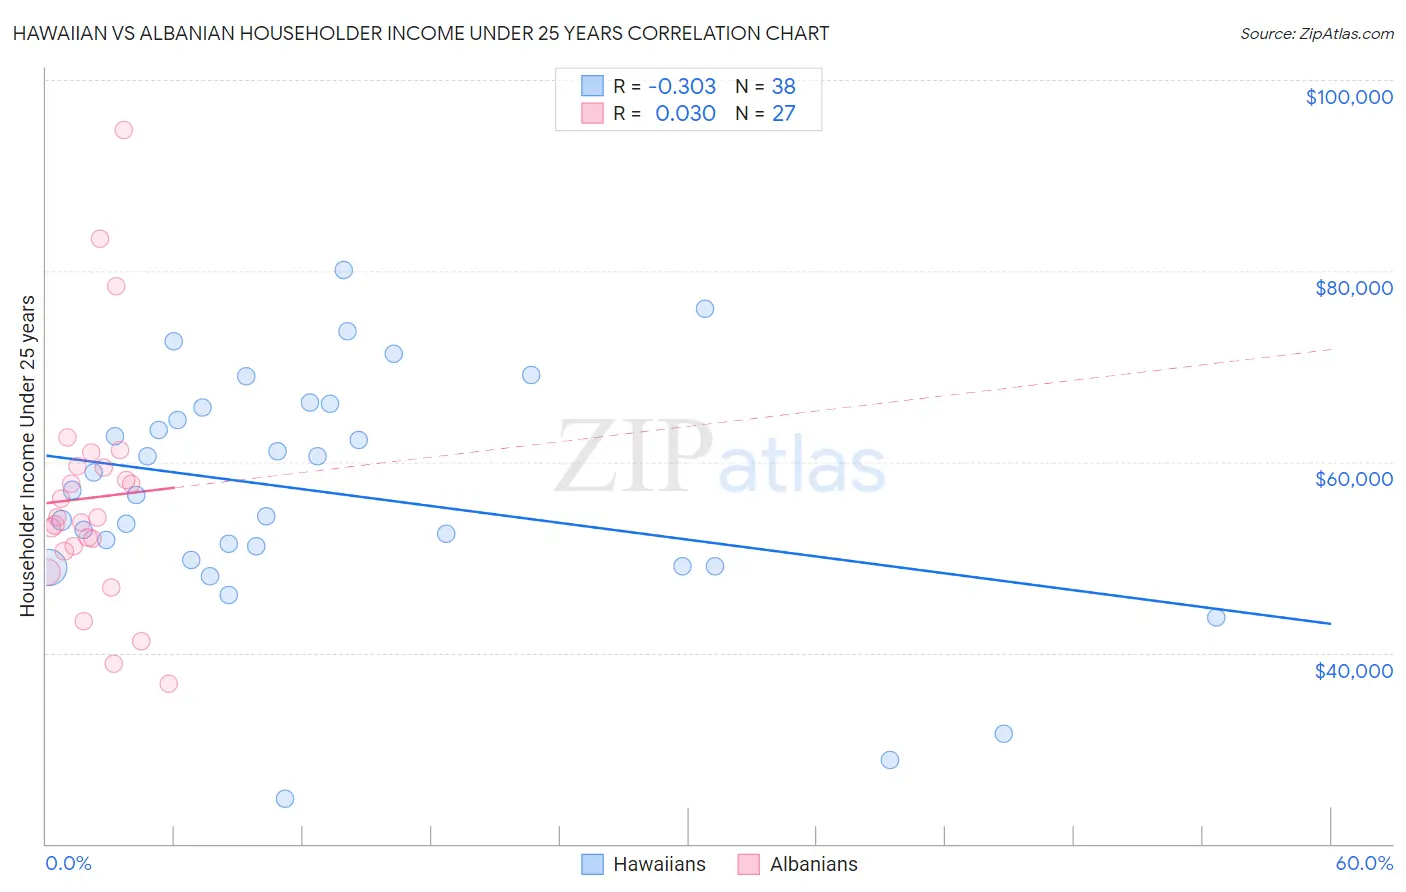
Hawaiian vs Albanian Householder Income Under 25 years Correlation Chart
The statistical analysis conducted on geographies consisting of 288,171,696 people shows a mild negative correlation between the proportion of Hawaiians and household income with householder under the age of 25 in the United States with a correlation coefficient (R) of -0.303 and weighted average of $53,078. Similarly, the statistical analysis conducted on geographies consisting of 168,875,521 people shows no correlation between the proportion of Albanians and household income with householder under the age of 25 in the United States with a correlation coefficient (R) of 0.030 and weighted average of $53,794, a difference of 1.3%.
Householder Income Under 25 years Correlation Summary
| Measurement | Hawaiian | Albanian |
| Minimum | $24,709 | $36,785 |
| Maximum | $80,098 | $94,768 |
| Range | $55,389 | $57,984 |
| Mean | $56,783 | $56,271 |
| Median | $56,779 | $54,178 |
| Interquartile 25% (IQ1) | $49,786 | $50,650 |
| Interquartile 75% (IQ3) | $65,721 | $59,543 |
| Interquartile Range (IQR) | $15,935 | $8,893 |
| Standard Deviation (Sample) | $12,327 | $12,666 |
| Standard Deviation (Population) | $12,164 | $12,429 |
Similar Demographics by Householder Income Under 25 years
Demographics Similar to Hawaiians by Householder Income Under 25 years
In terms of householder income under 25 years, the demographic groups most similar to Hawaiians are Costa Rican ($53,106, a difference of 0.050%), Danish ($53,041, a difference of 0.070%), Norwegian ($53,127, a difference of 0.090%), Immigrants from Barbados ($53,163, a difference of 0.16%), and Immigrants from Armenia ($52,986, a difference of 0.17%).
| Demographics | Rating | Rank | Householder Income Under 25 years |
| Immigrants | Immigrants | 92.2 /100 | #133 | Exceptional $53,201 |
| Immigrants | Northern Africa | 91.9 /100 | #134 | Exceptional $53,185 |
| Chileans | 91.9 /100 | #135 | Exceptional $53,185 |
| Armenians | 91.8 /100 | #136 | Exceptional $53,179 |
| Immigrants | Barbados | 91.5 /100 | #137 | Exceptional $53,163 |
| Norwegians | 90.8 /100 | #138 | Exceptional $53,127 |
| Costa Ricans | 90.4 /100 | #139 | Exceptional $53,106 |
| Hawaiians | 89.8 /100 | #140 | Excellent $53,078 |
| Danes | 88.9 /100 | #141 | Excellent $53,041 |
| Immigrants | Armenia | 87.5 /100 | #142 | Excellent $52,986 |
| Swedes | 87.5 /100 | #143 | Excellent $52,986 |
| South American Indians | 87.3 /100 | #144 | Excellent $52,979 |
| Immigrants | Western Europe | 86.7 /100 | #145 | Excellent $52,957 |
| Immigrants | Hungary | 81.6 /100 | #146 | Excellent $52,798 |
| Latvians | 81.0 /100 | #147 | Excellent $52,783 |
Demographics Similar to Albanians by Householder Income Under 25 years
In terms of householder income under 25 years, the demographic groups most similar to Albanians are Immigrants from France ($53,805, a difference of 0.020%), Ethiopian ($53,818, a difference of 0.050%), Ukrainian ($53,843, a difference of 0.090%), Australian ($53,739, a difference of 0.10%), and Maltese ($53,735, a difference of 0.11%).
| Demographics | Rating | Rank | Householder Income Under 25 years |
| Alaska Natives | 98.8 /100 | #99 | Exceptional $54,000 |
| Immigrants | Kazakhstan | 98.8 /100 | #100 | Exceptional $53,990 |
| South Americans | 98.6 /100 | #101 | Exceptional $53,939 |
| Ecuadorians | 98.5 /100 | #102 | Exceptional $53,911 |
| Ukrainians | 98.3 /100 | #103 | Exceptional $53,843 |
| Ethiopians | 98.2 /100 | #104 | Exceptional $53,818 |
| Immigrants | France | 98.1 /100 | #105 | Exceptional $53,805 |
| Albanians | 98.1 /100 | #106 | Exceptional $53,794 |
| Australians | 97.8 /100 | #107 | Exceptional $53,739 |
| Maltese | 97.8 /100 | #108 | Exceptional $53,735 |
| Immigrants | Ecuador | 97.7 /100 | #109 | Exceptional $53,722 |
| Greeks | 97.7 /100 | #110 | Exceptional $53,715 |
| Immigrants | Colombia | 97.7 /100 | #111 | Exceptional $53,714 |
| Immigrants | Oceania | 97.5 /100 | #112 | Exceptional $53,680 |
| Romanians | 97.2 /100 | #113 | Exceptional $53,632 |