Guyanese vs Inupiat Male Poverty
COMPARE
Guyanese
Inupiat
Male Poverty
Male Poverty Comparison
Guyanese
Inupiat
13.3%
MALE POVERTY
0.0/ 100
METRIC RATING
269th/ 347
METRIC RANK
14.0%
MALE POVERTY
0.0/ 100
METRIC RATING
297th/ 347
METRIC RANK
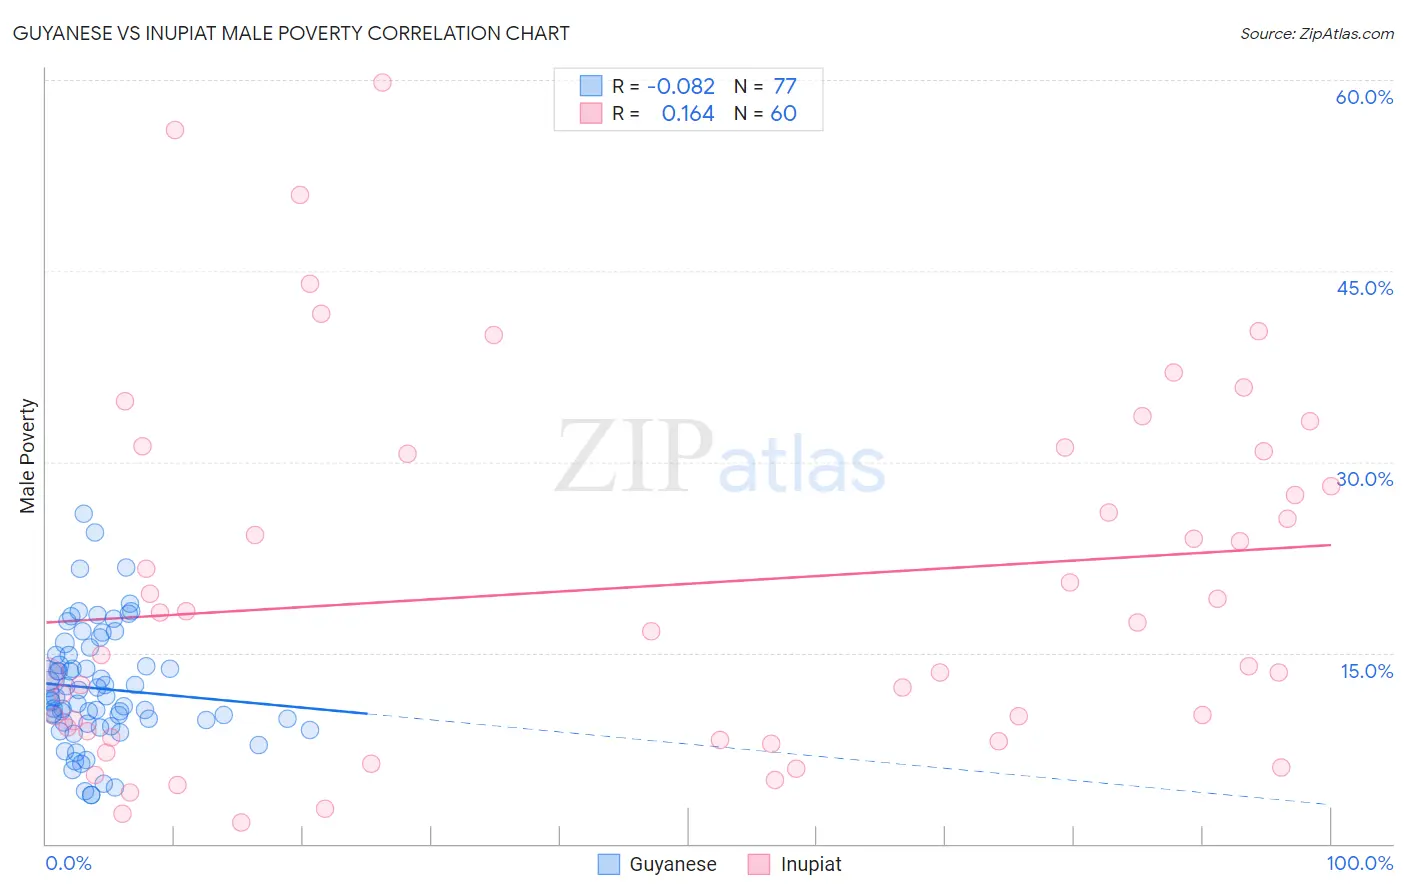
Guyanese vs Inupiat Male Poverty Correlation Chart
The statistical analysis conducted on geographies consisting of 176,774,769 people shows a slight negative correlation between the proportion of Guyanese and poverty level among males in the United States with a correlation coefficient (R) of -0.082 and weighted average of 13.3%. Similarly, the statistical analysis conducted on geographies consisting of 96,314,568 people shows a poor positive correlation between the proportion of Inupiat and poverty level among males in the United States with a correlation coefficient (R) of 0.164 and weighted average of 14.0%, a difference of 5.4%.
Male Poverty Correlation Summary
| Measurement | Guyanese | Inupiat |
| Minimum | 3.8% | 1.7% |
| Maximum | 25.9% | 59.8% |
| Range | 22.1% | 58.1% |
| Mean | 12.2% | 20.1% |
| Median | 11.5% | 17.0% |
| Interquartile 25% (IQ1) | 9.5% | 8.6% |
| Interquartile 75% (IQ3) | 14.8% | 30.7% |
| Interquartile Range (IQR) | 5.3% | 22.1% |
| Standard Deviation (Sample) | 4.6% | 14.1% |
| Standard Deviation (Population) | 4.6% | 14.0% |
Similar Demographics by Male Poverty
Demographics Similar to Guyanese by Male Poverty
In terms of male poverty, the demographic groups most similar to Guyanese are Subsaharan African (13.3%, a difference of 0.22%), Immigrants from Jamaica (13.3%, a difference of 0.25%), Immigrants from Guyana (13.2%, a difference of 0.36%), Cree (13.3%, a difference of 0.47%), and Spanish American (13.4%, a difference of 0.50%).
| Demographics | Rating | Rank | Male Poverty |
| Spanish American Indians | 0.1 /100 | #262 | Tragic 13.1% |
| Central Americans | 0.1 /100 | #263 | Tragic 13.2% |
| Iroquois | 0.1 /100 | #264 | Tragic 13.2% |
| Jamaicans | 0.1 /100 | #265 | Tragic 13.2% |
| Immigrants | Guyana | 0.1 /100 | #266 | Tragic 13.2% |
| Immigrants | Jamaica | 0.1 /100 | #267 | Tragic 13.3% |
| Sub-Saharan Africans | 0.1 /100 | #268 | Tragic 13.3% |
| Guyanese | 0.0 /100 | #269 | Tragic 13.3% |
| Cree | 0.0 /100 | #270 | Tragic 13.3% |
| Spanish Americans | 0.0 /100 | #271 | Tragic 13.4% |
| Immigrants | Bahamas | 0.0 /100 | #272 | Tragic 13.5% |
| Chickasaw | 0.0 /100 | #273 | Tragic 13.5% |
| Immigrants | West Indies | 0.0 /100 | #274 | Tragic 13.5% |
| Barbadians | 0.0 /100 | #275 | Tragic 13.6% |
| Immigrants | Latin America | 0.0 /100 | #276 | Tragic 13.6% |
Demographics Similar to Inupiat by Male Poverty
In terms of male poverty, the demographic groups most similar to Inupiat are Blackfeet (14.0%, a difference of 0.030%), Immigrants from Guatemala (14.0%, a difference of 0.13%), Immigrants from Mexico (14.0%, a difference of 0.25%), Immigrants from Senegal (14.0%, a difference of 0.32%), and Immigrants from Caribbean (14.0%, a difference of 0.37%).
| Demographics | Rating | Rank | Male Poverty |
| Immigrants | Zaire | 0.0 /100 | #290 | Tragic 13.8% |
| Vietnamese | 0.0 /100 | #291 | Tragic 13.8% |
| Indonesians | 0.0 /100 | #292 | Tragic 13.8% |
| Immigrants | Belize | 0.0 /100 | #293 | Tragic 13.8% |
| Hispanics or Latinos | 0.0 /100 | #294 | Tragic 13.9% |
| Immigrants | Central America | 0.0 /100 | #295 | Tragic 13.9% |
| Cajuns | 0.0 /100 | #296 | Tragic 13.9% |
| Inupiat | 0.0 /100 | #297 | Tragic 14.0% |
| Blackfeet | 0.0 /100 | #298 | Tragic 14.0% |
| Immigrants | Guatemala | 0.0 /100 | #299 | Tragic 14.0% |
| Immigrants | Mexico | 0.0 /100 | #300 | Tragic 14.0% |
| Immigrants | Senegal | 0.0 /100 | #301 | Tragic 14.0% |
| Immigrants | Caribbean | 0.0 /100 | #302 | Tragic 14.0% |
| Bahamians | 0.0 /100 | #303 | Tragic 14.1% |
| Senegalese | 0.0 /100 | #304 | Tragic 14.1% |