Guyanese vs Inupiat 8th Grade

COMPARE

Guyanese
Race
Ancestry
AfghanAfricanAlaska NativeAlaskan AthabascanAlbanianAleutAlsatianAmericanApacheArabArapahoArgentineanArmenianAssyrian/Chaldean/SyriacAustralianAustrianBahamianBangladeshiBarbadianBasqueBelgianBelizeanBermudanBhutaneseBlackfeetBolivianBrazilianBritishBritish West IndianBulgarianBurmeseCajunCambodianCanadianCape VerdeanCarpatho RusynCelticCentral AmericanCentral American IndianCherokeeCheyenneChickasawChileanChineseChippewaChoctawColombianColvilleComancheCosta RicanCreeCreekCroatianCrowCubanCypriotCzechCzechoslovakianDanishDelawareDominicanDutchDutch West IndianEastern EuropeanEcuadorianEgyptianEnglishEstonianEthiopianEuropeanFijianFilipinoFinnishFrenchFrench American IndianFrench CanadianGermanGerman RussianGhanaianGreekGuamanian/ChamorroGuatemalanGuyaneseHaitianHmongHonduranHopiHoumaHungarianIcelanderIndian (Asian)IndonesianIranianIraqiIrishIroquoisIsraeliItalianJamaicanJapaneseJordanianKenyanKiowaKoreanLaotianLatvianLebaneseLiberianLithuanianLumbeeLuxembourgerMacedonianMalaysianMalteseMarshalleseMenomineeMexicanMexican American IndianMongolianMoroccanNative HawaiianNavajoNepaleseNew ZealanderNicaraguanNigerianNorthern EuropeanNorwegianOkinawanOsageOttawaPaiutePakistaniPalestinianPanamanianParaguayanPennsylvania GermanPeruvianPimaPolishPortuguesePotawatomiPuebloPuerto RicanPuget Sound SalishRomanianRussianSalvadoranSamoanScandinavianScotch-IrishScottishSeminoleSenegaleseSerbianShoshoneSierra LeoneanSiouxSlavicSlovakSloveneSomaliSouth AfricanSouth AmericanSouth American IndianSoviet UnionSpaniardSpanishSpanish AmericanSpanish American IndianSri LankanSubsaharan AfricanSudaneseSwedishSwissSyrianTaiwaneseThaiTlingit-HaidaTohono O'OdhamTonganTrinidadian and TobagonianTsimshianTurkishU.S. Virgin IslanderUgandanUkrainianUruguayanUteVenezuelanVietnameseWelshWest IndianYakamaYaquiYugoslavianYumanYup'ikZimbabwean
Immigration
NonimmigrantsImmigrantsAfghanistanAfricaAlbaniaArgentinaArmeniaAsiaAustraliaAustriaBahamasBangladeshBarbadosBelarusBelgiumBelizeBoliviaBosnia and HerzegovinaBrazilBulgariaBurma/MyanmarCabo VerdeCambodiaCameroonCanadaCaribbeanCentral AmericaChileChinaColombiaCongoCosta RicaCroatiaCubaCzechoslovakiaDenmarkDominicaDominican RepublicEastern AfricaEastern AsiaEastern EuropeEcuadorEgyptEl SalvadorEnglandEritreaEthiopiaEuropeFijiFranceGermanyGhanaGreeceGrenadaGuatemalaGuyanaHaitiHondurasHong KongHungaryIndiaIndonesiaIranIraqIrelandIsraelItalyJamaicaJapanJordanKazakhstanKenyaKoreaKuwaitLaosLatin AmericaLatviaLebanonLiberiaLithuaniaMalaysiaMexicoMicronesiaMiddle AfricaMoldovaMoroccoNepalNetherlandsNicaraguaNigeriaNorth AmericaNorth MacedoniaNorthern AfricaNorthern EuropeNorwayOceaniaPakistanPanamaPeruPhilippinesPolandPortugalRomaniaRussiaSaudi ArabiaScotlandSenegalSerbiaSierra LeoneSingaporeSomaliaSouth AfricaSouth AmericaSouth Central AsiaSouth Eastern AsiaSouthern EuropeSpainSri LankaSt. Vincent and the GrenadinesSudanSwedenSwitzerlandSyriaTaiwanThailandTrinidad and TobagoTurkeyUgandaUkraineUruguayUzbekistanVenezuelaVietnamWest IndiesWestern AfricaWestern AsiaWestern EuropeYemenZaireZimbabweAzores
Inupiat
Race
Ancestry
AfghanAfricanAlaska NativeAlaskan AthabascanAlbanianAleutAlsatianAmericanApacheArabArapahoArgentineanArmenianAssyrian/Chaldean/SyriacAustralianAustrianBahamianBangladeshiBarbadianBasqueBelgianBelizeanBermudanBhutaneseBlackfeetBolivianBrazilianBritishBritish West IndianBulgarianBurmeseCajunCambodianCanadianCape VerdeanCarpatho RusynCelticCentral AmericanCentral American IndianCherokeeCheyenneChickasawChileanChineseChippewaChoctawColombianColvilleComancheCosta RicanCreeCreekCroatianCrowCubanCypriotCzechCzechoslovakianDanishDelawareDominicanDutchDutch West IndianEastern EuropeanEcuadorianEgyptianEnglishEstonianEthiopianEuropeanFijianFilipinoFinnishFrenchFrench American IndianFrench CanadianGermanGerman RussianGhanaianGreekGuamanian/ChamorroGuatemalanHaitianHmongHonduranHopiHoumaHungarianIcelanderIndian (Asian)IndonesianInupiatIranianIraqiIrishIroquoisIsraeliItalianJamaicanJapaneseJordanianKenyanKiowaKoreanLaotianLatvianLebaneseLiberianLithuanianLumbeeLuxembourgerMacedonianMalaysianMalteseMarshalleseMenomineeMexicanMexican American IndianMongolianMoroccanNative HawaiianNavajoNepaleseNew ZealanderNicaraguanNigerianNorthern EuropeanNorwegianOkinawanOsageOttawaPaiutePakistaniPalestinianPanamanianParaguayanPennsylvania GermanPeruvianPimaPolishPortuguesePotawatomiPuebloPuerto RicanPuget Sound SalishRomanianRussianSalvadoranSamoanScandinavianScotch-IrishScottishSeminoleSenegaleseSerbianShoshoneSierra LeoneanSiouxSlavicSlovakSloveneSomaliSouth AfricanSouth AmericanSouth American IndianSoviet UnionSpaniardSpanishSpanish AmericanSpanish American IndianSri LankanSubsaharan AfricanSudaneseSwedishSwissSyrianTaiwaneseThaiTlingit-HaidaTohono O'OdhamTonganTrinidadian and TobagonianTsimshianTurkishU.S. Virgin IslanderUgandanUkrainianUruguayanUteVenezuelanVietnameseWelshWest IndianYakamaYaquiYugoslavianYumanYup'ikZimbabwean
Immigration
NonimmigrantsImmigrantsAfghanistanAfricaAlbaniaArgentinaArmeniaAsiaAustraliaAustriaBahamasBangladeshBarbadosBelarusBelgiumBelizeBoliviaBosnia and HerzegovinaBrazilBulgariaBurma/MyanmarCabo VerdeCambodiaCameroonCanadaCaribbeanCentral AmericaChileChinaColombiaCongoCosta RicaCroatiaCubaCzechoslovakiaDenmarkDominicaDominican RepublicEastern AfricaEastern AsiaEastern EuropeEcuadorEgyptEl SalvadorEnglandEritreaEthiopiaEuropeFijiFranceGermanyGhanaGreeceGrenadaGuatemalaGuyanaHaitiHondurasHong KongHungaryIndiaIndonesiaIranIraqIrelandIsraelItalyJamaicaJapanJordanKazakhstanKenyaKoreaKuwaitLaosLatin AmericaLatviaLebanonLiberiaLithuaniaMalaysiaMexicoMicronesiaMiddle AfricaMoldovaMoroccoNepalNetherlandsNicaraguaNigeriaNorth AmericaNorth MacedoniaNorthern AfricaNorthern EuropeNorwayOceaniaPakistanPanamaPeruPhilippinesPolandPortugalRomaniaRussiaSaudi ArabiaScotlandSenegalSerbiaSierra LeoneSingaporeSomaliaSouth AfricaSouth AmericaSouth Central AsiaSouth Eastern AsiaSouthern EuropeSpainSri LankaSt. Vincent and the GrenadinesSudanSwedenSwitzerlandSyriaTaiwanThailandTrinidad and TobagoTurkeyUgandaUkraineUruguayUzbekistanVenezuelaVietnamWest IndiesWestern AfricaWestern AsiaWestern EuropeYemenZaireZimbabweAzores
8th Grade
Income
Poverty
Unemployment
Labor Participation
Family Structure
Vehicle Availability
Education Level
Disability

8th Grade Comparison

Guyanese

Inupiat

Tragic
Exceptional
93.9%
8TH GRADE
0.0/ 100
METRIC RATING
304th/ 347
METRIC RANK
97.0%
8TH GRADE
100.0/ 100
METRIC RATING
40th/ 347
METRIC RANK

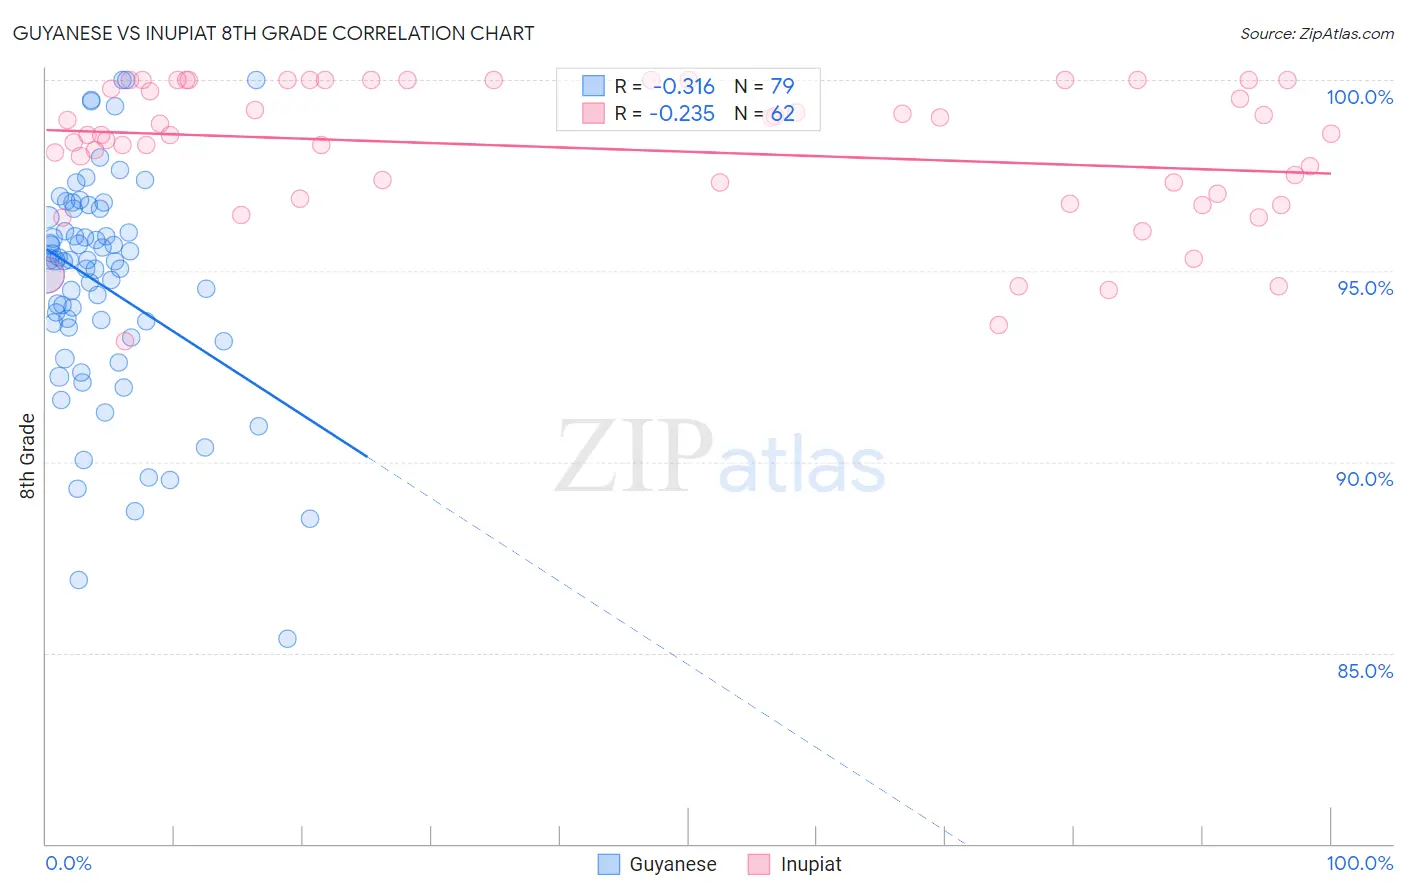
Guyanese vs Inupiat 8th Grade Correlation Chart

The statistical analysis conducted on geographies consisting of 176,937,226 people shows a mild negative correlation between the proportion of Guyanese and percentage of population with at least 8th grade education in the United States with a correlation coefficient (R) of -0.316 and weighted average of 93.9%. Similarly, the statistical analysis conducted on geographies consisting of 96,348,974 people shows a weak negative correlation between the proportion of Inupiat and percentage of population with at least 8th grade education in the United States with a correlation coefficient (R) of -0.235 and weighted average of 97.0%, a difference of 3.3%.
Guyanese vs Inupiat 8th Grade

8th Grade Correlation Summary

MeasurementGuyaneseInupiat
Minimum85.4%93.2%
Maximum100.0%100.0%
Range14.6%6.8%
Mean94.6%98.2%
Median95.3%98.6%
Interquartile 25% (IQ1)93.3%97.0%
Interquartile 75% (IQ3)96.4%100.0%
Interquartile Range (IQR)3.1%3.0%
Standard Deviation (Sample)2.9%1.8%
Standard Deviation (Population)2.9%1.8%

Similar Demographics by 8th Grade

Demographics Similar to Guyanese by 8th Grade

In terms of 8th grade, the demographic groups most similar to Guyanese are Immigrants from Haiti (93.9%, a difference of 0.030%), Immigrants from Dominica (94.0%, a difference of 0.080%), Sri Lankan (94.0%, a difference of 0.13%), Immigrants from Guyana (93.8%, a difference of 0.13%), and Immigrants from Portugal (93.8%, a difference of 0.14%).
DemographicsRating | Rank8th Grade
Immigrants | South Eastern Asia
0.0
/100
|
#297
Tragic
94.2%
Indonesians
0.0
/100
|
#298
Tragic
94.1%
Cubans
0.0
/100
|
#299
Tragic
94.1%
Immigrants | Burma/Myanmar
0.0
/100
|
#300
Tragic
94.1%
Immigrants | Laos
0.0
/100
|
#301
Tragic
94.1%
Sri Lankans
0.0
/100
|
#302
Tragic
94.0%
Immigrants | Dominica
0.0
/100
|
#303
Tragic
94.0%
Guyanese
0.0
/100
|
#304
Tragic
93.9%
Immigrants | Haiti
0.0
/100
|
#305
Tragic
93.9%
Immigrants | Guyana
0.0
/100
|
#306
Tragic
93.8%
Immigrants | Portugal
0.0
/100
|
#307
Tragic
93.8%
Ecuadorians
0.0
/100
|
#308
Tragic
93.6%
Immigrants | Immigrants
0.0
/100
|
#309
Tragic
93.6%
Japanese
0.0
/100
|
#310
Tragic
93.6%
Immigrants | Bangladesh
0.0
/100
|
#311
Tragic
93.6%

Demographics Similar to Inupiat by 8th Grade

In terms of 8th grade, the demographic groups most similar to Inupiat are Eastern European (97.0%, a difference of 0.0%), Hungarian (97.0%, a difference of 0.010%), British (97.0%, a difference of 0.020%), Latvian (97.0%, a difference of 0.030%), and Alaska Native (97.0%, a difference of 0.040%).
DemographicsRating | Rank8th Grade
Swiss
100.0
/100
|
#33
Exceptional
97.0%
Luxembourgers
100.0
/100
|
#34
Exceptional
97.0%
Alaska Natives
100.0
/100
|
#35
Exceptional
97.0%
Belgians
100.0
/100
|
#36
Exceptional
97.0%
Latvians
100.0
/100
|
#37
Exceptional
97.0%
British
100.0
/100
|
#38
Exceptional
97.0%
Hungarians
100.0
/100
|
#39
Exceptional
97.0%
Inupiat
100.0
/100
|
#40
Exceptional
97.0%
Eastern Europeans
100.0
/100
|
#41
Exceptional
97.0%
Chinese
100.0
/100
|
#42
Exceptional
96.9%
Aleuts
99.9
/100
|
#43
Exceptional
96.9%
Maltese
99.9
/100
|
#44
Exceptional
96.9%
Northern Europeans
99.9
/100
|
#45
Exceptional
96.9%
Czechoslovakians
99.9
/100
|
#46
Exceptional
96.9%
Bulgarians
99.9
/100
|
#47
Exceptional
96.9%