Guatemalan vs Maltese Single Male Poverty
COMPARE
Guatemalan
Maltese
Single Male Poverty
Single Male Poverty Comparison
Guatemalans
Maltese
13.8%
SINGLE MALE POVERTY
0.3/ 100
METRIC RATING
259th/ 347
METRIC RANK
11.3%
SINGLE MALE POVERTY
100.0/ 100
METRIC RATING
25th/ 347
METRIC RANK
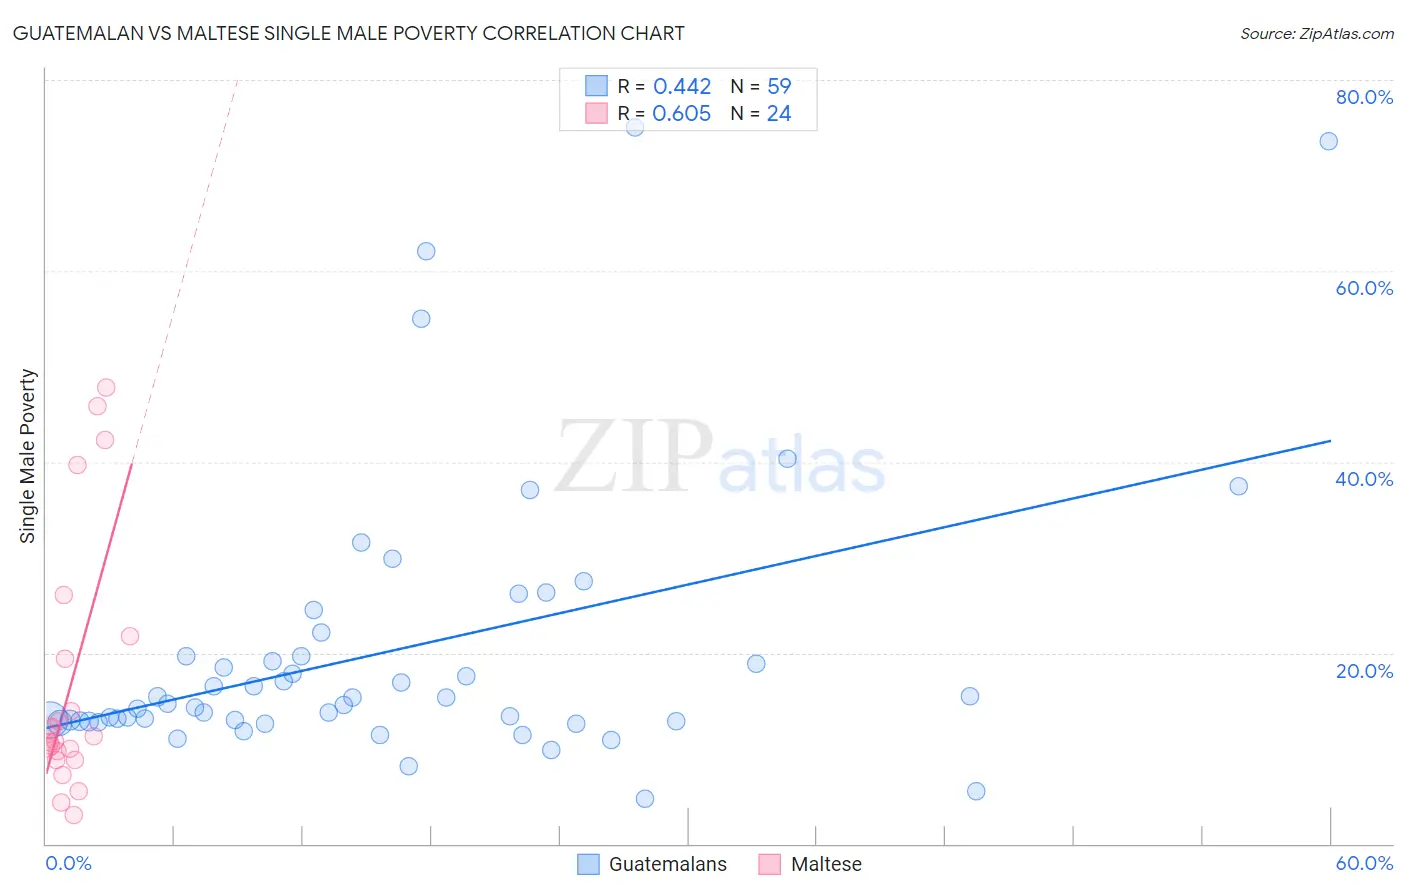
Guatemalan vs Maltese Single Male Poverty Correlation Chart
The statistical analysis conducted on geographies consisting of 366,968,196 people shows a moderate positive correlation between the proportion of Guatemalans and poverty level among single males in the United States with a correlation coefficient (R) of 0.442 and weighted average of 13.8%. Similarly, the statistical analysis conducted on geographies consisting of 117,992,298 people shows a significant positive correlation between the proportion of Maltese and poverty level among single males in the United States with a correlation coefficient (R) of 0.605 and weighted average of 11.3%, a difference of 22.3%.
Single Male Poverty Correlation Summary
| Measurement | Guatemalan | Maltese |
| Minimum | 4.7% | 3.0% |
| Maximum | 75.0% | 47.8% |
| Range | 70.3% | 44.8% |
| Mean | 20.2% | 16.8% |
| Median | 14.7% | 10.9% |
| Interquartile 25% (IQ1) | 12.8% | 9.2% |
| Interquartile 75% (IQ3) | 19.7% | 20.5% |
| Interquartile Range (IQR) | 6.9% | 11.3% |
| Standard Deviation (Sample) | 14.7% | 13.4% |
| Standard Deviation (Population) | 14.5% | 13.1% |
Similar Demographics by Single Male Poverty
Demographics Similar to Guatemalans by Single Male Poverty
In terms of single male poverty, the demographic groups most similar to Guatemalans are Immigrants from Guatemala (13.8%, a difference of 0.040%), Swiss (13.8%, a difference of 0.070%), Immigrants from Central America (13.8%, a difference of 0.11%), Hungarian (13.8%, a difference of 0.12%), and Immigrants from Belize (13.7%, a difference of 0.29%).
| Demographics | Rating | Rank | Single Male Poverty |
| Finns | 0.9 /100 | #252 | Tragic 13.6% |
| German Russians | 0.8 /100 | #253 | Tragic 13.6% |
| Sub-Saharan Africans | 0.5 /100 | #254 | Tragic 13.7% |
| Spaniards | 0.4 /100 | #255 | Tragic 13.7% |
| Immigrants | Belize | 0.4 /100 | #256 | Tragic 13.7% |
| Immigrants | Central America | 0.3 /100 | #257 | Tragic 13.8% |
| Immigrants | Guatemala | 0.3 /100 | #258 | Tragic 13.8% |
| Guatemalans | 0.3 /100 | #259 | Tragic 13.8% |
| Swiss | 0.3 /100 | #260 | Tragic 13.8% |
| Hungarians | 0.3 /100 | #261 | Tragic 13.8% |
| Fijians | 0.3 /100 | #262 | Tragic 13.8% |
| Cape Verdeans | 0.2 /100 | #263 | Tragic 13.8% |
| West Indians | 0.2 /100 | #264 | Tragic 13.8% |
| Immigrants | Congo | 0.2 /100 | #265 | Tragic 13.9% |
| Immigrants | Cabo Verde | 0.1 /100 | #266 | Tragic 13.9% |
Demographics Similar to Maltese by Single Male Poverty
In terms of single male poverty, the demographic groups most similar to Maltese are Indian (Asian) (11.3%, a difference of 0.020%), Bolivian (11.2%, a difference of 0.22%), Immigrants from Japan (11.3%, a difference of 0.33%), Immigrants from Pakistan (11.2%, a difference of 0.43%), and Asian (11.2%, a difference of 0.52%).
| Demographics | Rating | Rank | Single Male Poverty |
| Immigrants | Bolivia | 100.0 /100 | #18 | Exceptional 11.1% |
| Immigrants | Moldova | 100.0 /100 | #19 | Exceptional 11.2% |
| Ethiopians | 100.0 /100 | #20 | Exceptional 11.2% |
| Asians | 100.0 /100 | #21 | Exceptional 11.2% |
| Immigrants | Pakistan | 100.0 /100 | #22 | Exceptional 11.2% |
| Bolivians | 100.0 /100 | #23 | Exceptional 11.2% |
| Indians (Asian) | 100.0 /100 | #24 | Exceptional 11.3% |
| Maltese | 100.0 /100 | #25 | Exceptional 11.3% |
| Immigrants | Japan | 100.0 /100 | #26 | Exceptional 11.3% |
| Immigrants | China | 100.0 /100 | #27 | Exceptional 11.4% |
| Immigrants | Asia | 100.0 /100 | #28 | Exceptional 11.4% |
| Immigrants | Egypt | 100.0 /100 | #29 | Exceptional 11.4% |
| Iranians | 100.0 /100 | #30 | Exceptional 11.4% |
| Immigrants | Iran | 100.0 /100 | #31 | Exceptional 11.4% |
| Immigrants | Eastern Asia | 100.0 /100 | #32 | Exceptional 11.4% |