Ghanaian vs Inupiat Single Male Poverty
COMPARE
Ghanaian
Inupiat
Single Male Poverty
Single Male Poverty Comparison
Ghanaians
Inupiat
13.3%
SINGLE MALE POVERTY
6.1/ 100
METRIC RATING
230th/ 347
METRIC RANK
20.0%
SINGLE MALE POVERTY
0.0/ 100
METRIC RATING
333rd/ 347
METRIC RANK
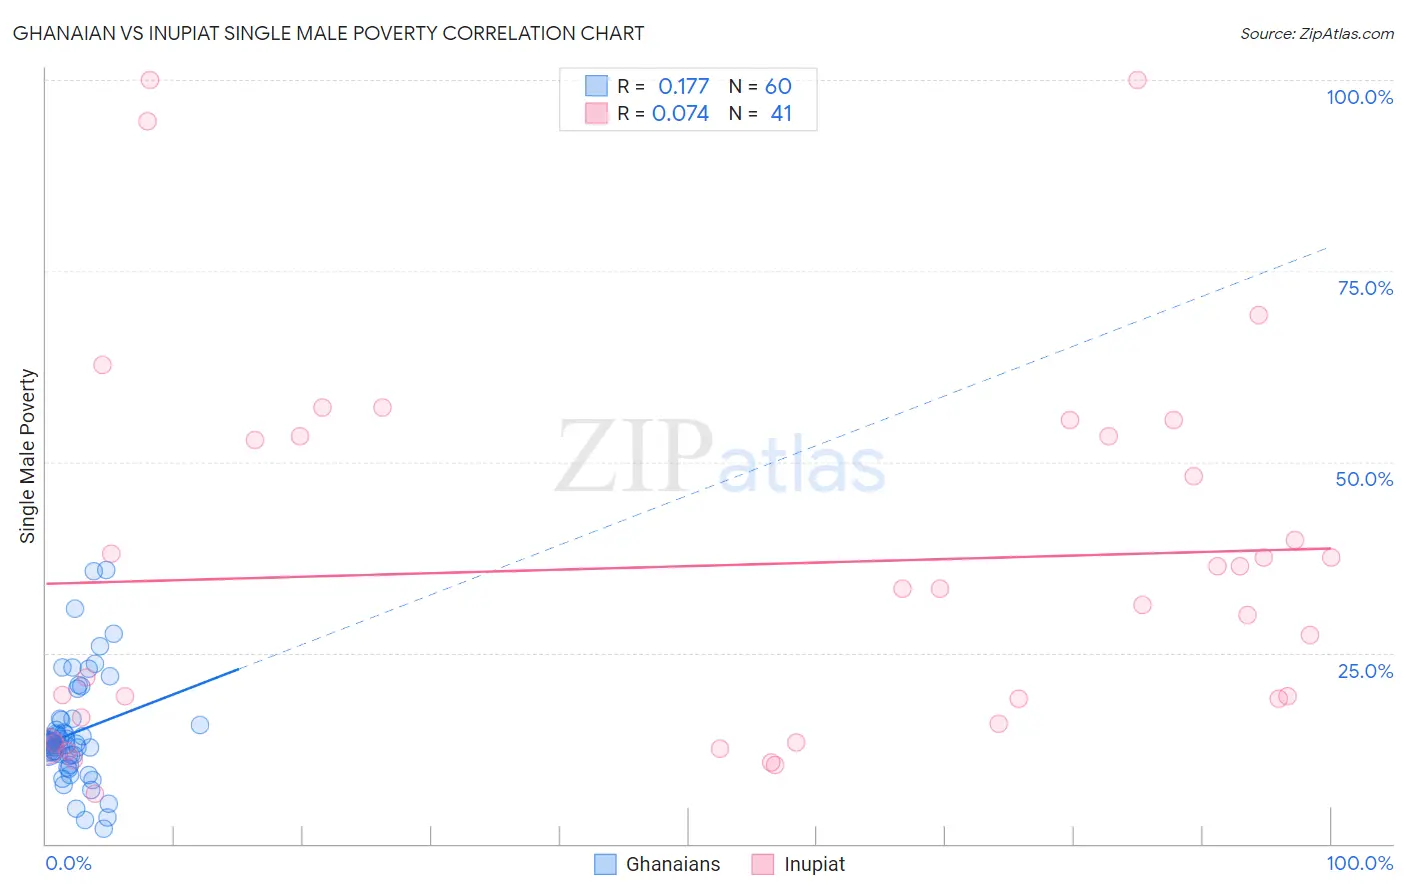
Ghanaian vs Inupiat Single Male Poverty Correlation Chart
The statistical analysis conducted on geographies consisting of 177,869,684 people shows a poor positive correlation between the proportion of Ghanaians and poverty level among single males in the United States with a correlation coefficient (R) of 0.177 and weighted average of 13.3%. Similarly, the statistical analysis conducted on geographies consisting of 93,554,052 people shows a slight positive correlation between the proportion of Inupiat and poverty level among single males in the United States with a correlation coefficient (R) of 0.074 and weighted average of 20.0%, a difference of 50.8%.
Single Male Poverty Correlation Summary
| Measurement | Ghanaian | Inupiat |
| Minimum | 2.0% | 6.5% |
| Maximum | 35.8% | 100.0% |
| Range | 33.9% | 93.5% |
| Mean | 14.5% | 36.4% |
| Median | 13.1% | 33.3% |
| Interquartile 25% (IQ1) | 11.5% | 16.1% |
| Interquartile 75% (IQ3) | 16.3% | 53.3% |
| Interquartile Range (IQR) | 4.8% | 37.2% |
| Standard Deviation (Sample) | 7.0% | 24.6% |
| Standard Deviation (Population) | 7.0% | 24.3% |
Similar Demographics by Single Male Poverty
Demographics Similar to Ghanaians by Single Male Poverty
In terms of single male poverty, the demographic groups most similar to Ghanaians are European (13.3%, a difference of 0.030%), Lebanese (13.2%, a difference of 0.12%), Slavic (13.3%, a difference of 0.18%), Haitian (13.2%, a difference of 0.20%), and Immigrants from Caribbean (13.3%, a difference of 0.27%).
| Demographics | Rating | Rank | Single Male Poverty |
| Immigrants | Azores | 9.3 /100 | #223 | Tragic 13.2% |
| Somalis | 9.1 /100 | #224 | Tragic 13.2% |
| Immigrants | Denmark | 8.7 /100 | #225 | Tragic 13.2% |
| Jamaicans | 7.7 /100 | #226 | Tragic 13.2% |
| Haitians | 7.0 /100 | #227 | Tragic 13.2% |
| Lebanese | 6.6 /100 | #228 | Tragic 13.2% |
| Europeans | 6.2 /100 | #229 | Tragic 13.3% |
| Ghanaians | 6.1 /100 | #230 | Tragic 13.3% |
| Slavs | 5.3 /100 | #231 | Tragic 13.3% |
| Immigrants | Caribbean | 5.0 /100 | #232 | Tragic 13.3% |
| British | 4.0 /100 | #233 | Tragic 13.3% |
| Canadians | 4.0 /100 | #234 | Tragic 13.3% |
| Bangladeshis | 3.7 /100 | #235 | Tragic 13.3% |
| Luxembourgers | 3.6 /100 | #236 | Tragic 13.4% |
| British West Indians | 3.4 /100 | #237 | Tragic 13.4% |
Demographics Similar to Inupiat by Single Male Poverty
In terms of single male poverty, the demographic groups most similar to Inupiat are Pima (20.2%, a difference of 0.80%), Native/Alaskan (19.6%, a difference of 1.9%), Paiute (19.3%, a difference of 3.6%), Cajun (19.1%, a difference of 4.8%), and Yuman (21.3%, a difference of 6.6%).
| Demographics | Rating | Rank | Single Male Poverty |
| Central American Indians | 0.0 /100 | #326 | Tragic 17.2% |
| Menominee | 0.0 /100 | #327 | Tragic 17.7% |
| Kiowa | 0.0 /100 | #328 | Tragic 18.3% |
| Colville | 0.0 /100 | #329 | Tragic 18.4% |
| Cajuns | 0.0 /100 | #330 | Tragic 19.1% |
| Paiute | 0.0 /100 | #331 | Tragic 19.3% |
| Natives/Alaskans | 0.0 /100 | #332 | Tragic 19.6% |
| Inupiat | 0.0 /100 | #333 | Tragic 20.0% |
| Pima | 0.0 /100 | #334 | Tragic 20.2% |
| Yuman | 0.0 /100 | #335 | Tragic 21.3% |
| Tohono O'odham | 0.0 /100 | #336 | Tragic 21.6% |
| Apache | 0.0 /100 | #337 | Tragic 21.6% |
| Pueblo | 0.0 /100 | #338 | Tragic 21.6% |
| Arapaho | 0.0 /100 | #339 | Tragic 21.9% |
| Sioux | 0.0 /100 | #340 | Tragic 22.2% |