Ghanaian vs Immigrants from Honduras Single Male Poverty
COMPARE
Ghanaian
Immigrants from Honduras
Single Male Poverty
Single Male Poverty Comparison
Ghanaians
Immigrants from Honduras
13.3%
SINGLE MALE POVERTY
6.1/ 100
METRIC RATING
230th/ 347
METRIC RANK
14.1%
SINGLE MALE POVERTY
0.0/ 100
METRIC RATING
277th/ 347
METRIC RANK
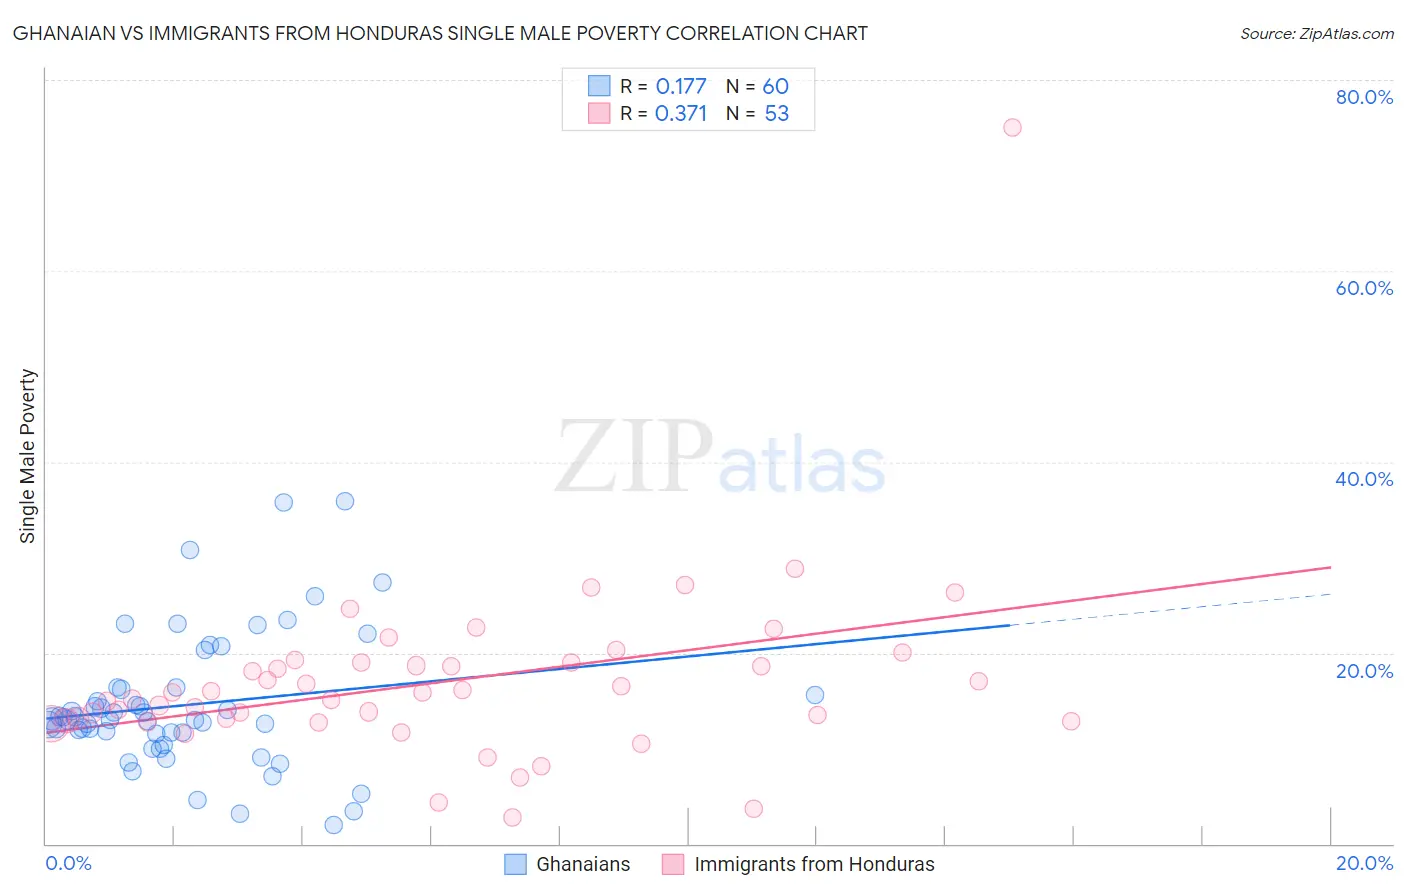
Ghanaian vs Immigrants from Honduras Single Male Poverty Correlation Chart
The statistical analysis conducted on geographies consisting of 177,869,684 people shows a poor positive correlation between the proportion of Ghanaians and poverty level among single males in the United States with a correlation coefficient (R) of 0.177 and weighted average of 13.3%. Similarly, the statistical analysis conducted on geographies consisting of 297,868,634 people shows a mild positive correlation between the proportion of Immigrants from Honduras and poverty level among single males in the United States with a correlation coefficient (R) of 0.371 and weighted average of 14.1%, a difference of 6.2%.
Single Male Poverty Correlation Summary
| Measurement | Ghanaian | Immigrants from Honduras |
| Minimum | 2.0% | 2.8% |
| Maximum | 35.8% | 75.0% |
| Range | 33.9% | 72.2% |
| Mean | 14.5% | 16.9% |
| Median | 13.1% | 15.8% |
| Interquartile 25% (IQ1) | 11.5% | 12.8% |
| Interquartile 75% (IQ3) | 16.3% | 19.0% |
| Interquartile Range (IQR) | 4.8% | 6.2% |
| Standard Deviation (Sample) | 7.0% | 9.9% |
| Standard Deviation (Population) | 7.0% | 9.8% |
Similar Demographics by Single Male Poverty
Demographics Similar to Ghanaians by Single Male Poverty
In terms of single male poverty, the demographic groups most similar to Ghanaians are European (13.3%, a difference of 0.030%), Lebanese (13.2%, a difference of 0.12%), Slavic (13.3%, a difference of 0.18%), Haitian (13.2%, a difference of 0.20%), and Immigrants from Caribbean (13.3%, a difference of 0.27%).
| Demographics | Rating | Rank | Single Male Poverty |
| Immigrants | Azores | 9.3 /100 | #223 | Tragic 13.2% |
| Somalis | 9.1 /100 | #224 | Tragic 13.2% |
| Immigrants | Denmark | 8.7 /100 | #225 | Tragic 13.2% |
| Jamaicans | 7.7 /100 | #226 | Tragic 13.2% |
| Haitians | 7.0 /100 | #227 | Tragic 13.2% |
| Lebanese | 6.6 /100 | #228 | Tragic 13.2% |
| Europeans | 6.2 /100 | #229 | Tragic 13.3% |
| Ghanaians | 6.1 /100 | #230 | Tragic 13.3% |
| Slavs | 5.3 /100 | #231 | Tragic 13.3% |
| Immigrants | Caribbean | 5.0 /100 | #232 | Tragic 13.3% |
| British | 4.0 /100 | #233 | Tragic 13.3% |
| Canadians | 4.0 /100 | #234 | Tragic 13.3% |
| Bangladeshis | 3.7 /100 | #235 | Tragic 13.3% |
| Luxembourgers | 3.6 /100 | #236 | Tragic 13.4% |
| British West Indians | 3.4 /100 | #237 | Tragic 13.4% |
Demographics Similar to Immigrants from Honduras by Single Male Poverty
In terms of single male poverty, the demographic groups most similar to Immigrants from Honduras are Dutch (14.1%, a difference of 0.040%), Slovak (14.1%, a difference of 0.060%), Indonesian (14.1%, a difference of 0.10%), English (14.1%, a difference of 0.16%), and Honduran (14.0%, a difference of 0.23%).
| Demographics | Rating | Rank | Single Male Poverty |
| Immigrants | Saudi Arabia | 0.1 /100 | #270 | Tragic 14.0% |
| Irish | 0.1 /100 | #271 | Tragic 14.0% |
| Mexicans | 0.1 /100 | #272 | Tragic 14.0% |
| Welsh | 0.1 /100 | #273 | Tragic 14.0% |
| Hondurans | 0.1 /100 | #274 | Tragic 14.0% |
| English | 0.1 /100 | #275 | Tragic 14.1% |
| Dutch | 0.1 /100 | #276 | Tragic 14.1% |
| Immigrants | Honduras | 0.0 /100 | #277 | Tragic 14.1% |
| Slovaks | 0.0 /100 | #278 | Tragic 14.1% |
| Indonesians | 0.0 /100 | #279 | Tragic 14.1% |
| Hmong | 0.0 /100 | #280 | Tragic 14.2% |
| Hispanics or Latinos | 0.0 /100 | #281 | Tragic 14.2% |
| Spanish Americans | 0.0 /100 | #282 | Tragic 14.2% |
| Yaqui | 0.0 /100 | #283 | Tragic 14.2% |
| Immigrants | Bahamas | 0.0 /100 | #284 | Tragic 14.4% |