French vs Cree Single Male Poverty
COMPARE
French
Cree
Single Male Poverty
Single Male Poverty Comparison
French
Cree
14.4%
SINGLE MALE POVERTY
0.0/ 100
METRIC RATING
285th/ 347
METRIC RANK
15.1%
SINGLE MALE POVERTY
0.0/ 100
METRIC RATING
300th/ 347
METRIC RANK
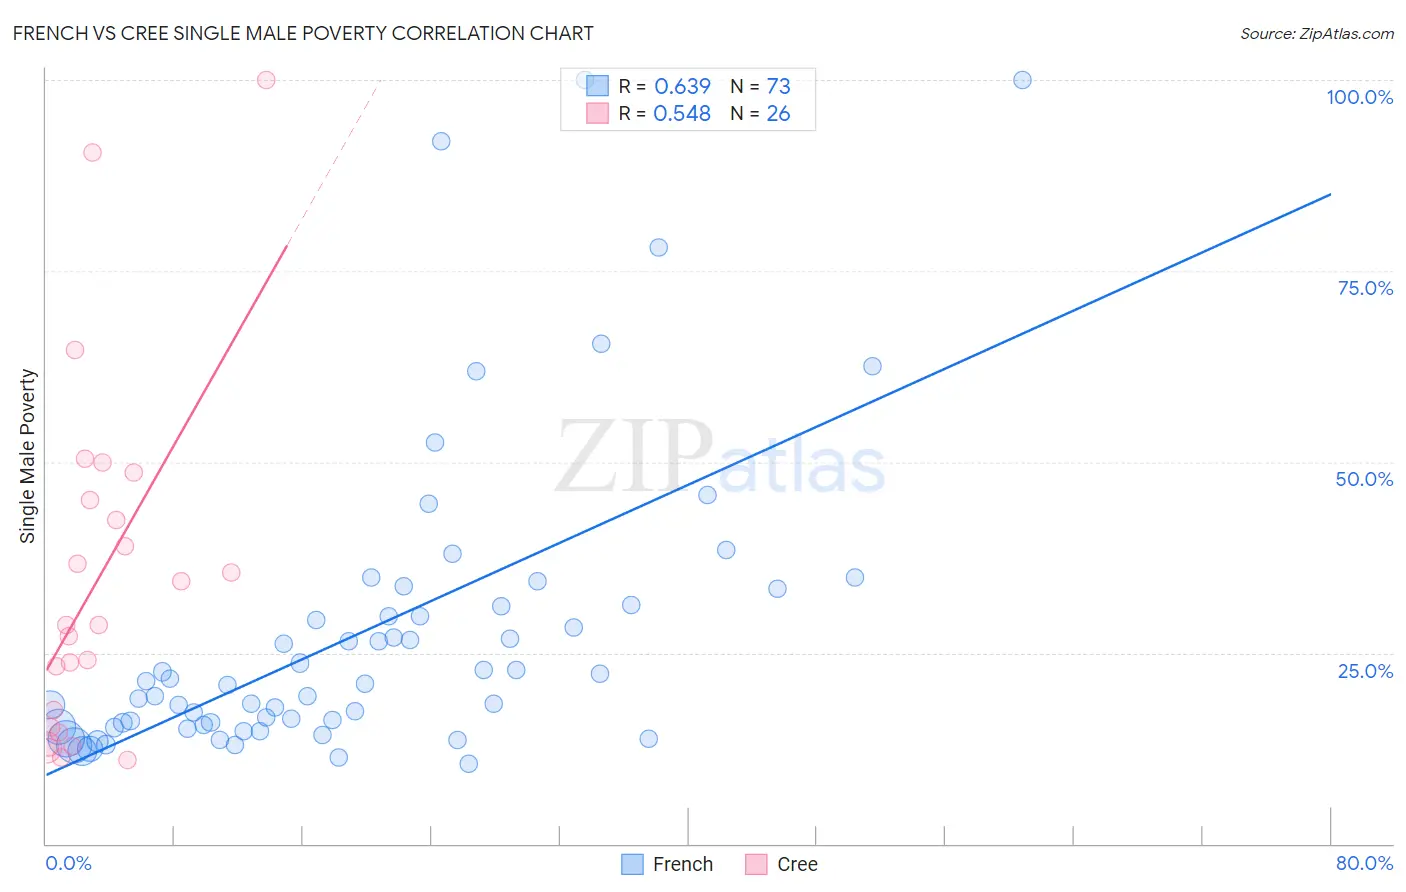
French vs Cree Single Male Poverty Correlation Chart
The statistical analysis conducted on geographies consisting of 472,532,664 people shows a significant positive correlation between the proportion of French and poverty level among single males in the United States with a correlation coefficient (R) of 0.639 and weighted average of 14.4%. Similarly, the statistical analysis conducted on geographies consisting of 73,575,391 people shows a substantial positive correlation between the proportion of Cree and poverty level among single males in the United States with a correlation coefficient (R) of 0.548 and weighted average of 15.1%, a difference of 4.7%.
Single Male Poverty Correlation Summary
| Measurement | French | Cree |
| Minimum | 10.5% | 11.0% |
| Maximum | 100.0% | 100.0% |
| Range | 89.5% | 89.0% |
| Mean | 27.8% | 34.6% |
| Median | 20.9% | 28.6% |
| Interquartile 25% (IQ1) | 15.4% | 15.2% |
| Interquartile 75% (IQ3) | 31.2% | 45.0% |
| Interquartile Range (IQR) | 15.7% | 29.8% |
| Standard Deviation (Sample) | 19.9% | 23.1% |
| Standard Deviation (Population) | 19.7% | 22.6% |
Demographics Similar to French and Cree by Single Male Poverty
In terms of single male poverty, the demographic groups most similar to French are Immigrants from Bahamas (14.4%, a difference of 0.13%), Celtic (14.5%, a difference of 0.32%), Iroquois (14.5%, a difference of 0.45%), White/Caucasian (14.5%, a difference of 0.45%), and Immigrants from Dominica (14.5%, a difference of 0.54%). Similarly, the demographic groups most similar to Cree are Delaware (15.0%, a difference of 0.45%), Dominican (15.2%, a difference of 0.82%), French American Indian (15.0%, a difference of 0.84%), Alsatian (15.2%, a difference of 0.98%), and Immigrants from Dominican Republic (14.8%, a difference of 2.1%).
| Demographics | Rating | Rank | Single Male Poverty |
| Spanish Americans | 0.0 /100 | #282 | Tragic 14.2% |
| Yaqui | 0.0 /100 | #283 | Tragic 14.2% |
| Immigrants | Bahamas | 0.0 /100 | #284 | Tragic 14.4% |
| French | 0.0 /100 | #285 | Tragic 14.4% |
| Celtics | 0.0 /100 | #286 | Tragic 14.5% |
| Iroquois | 0.0 /100 | #287 | Tragic 14.5% |
| Whites/Caucasians | 0.0 /100 | #288 | Tragic 14.5% |
| Immigrants | Dominica | 0.0 /100 | #289 | Tragic 14.5% |
| U.S. Virgin Islanders | 0.0 /100 | #290 | Tragic 14.5% |
| Bahamians | 0.0 /100 | #291 | Tragic 14.6% |
| Immigrants | Nonimmigrants | 0.0 /100 | #292 | Tragic 14.6% |
| French Canadians | 0.0 /100 | #293 | Tragic 14.6% |
| Ottawa | 0.0 /100 | #294 | Tragic 14.6% |
| Scotch-Irish | 0.0 /100 | #295 | Tragic 14.7% |
| Africans | 0.0 /100 | #296 | Tragic 14.7% |
| Immigrants | Dominican Republic | 0.0 /100 | #297 | Tragic 14.8% |
| French American Indians | 0.0 /100 | #298 | Tragic 15.0% |
| Delaware | 0.0 /100 | #299 | Tragic 15.0% |
| Cree | 0.0 /100 | #300 | Tragic 15.1% |
| Dominicans | 0.0 /100 | #301 | Tragic 15.2% |
| Alsatians | 0.0 /100 | #302 | Tragic 15.2% |