French vs Bhutanese Single Father Poverty
COMPARE
French
Bhutanese
Single Father Poverty
Single Father Poverty Comparison
French
Bhutanese
18.2%
SINGLE FATHER POVERTY
0.0/ 100
METRIC RATING
297th/ 347
METRIC RANK
15.0%
SINGLE FATHER POVERTY
99.9/ 100
METRIC RATING
50th/ 347
METRIC RANK
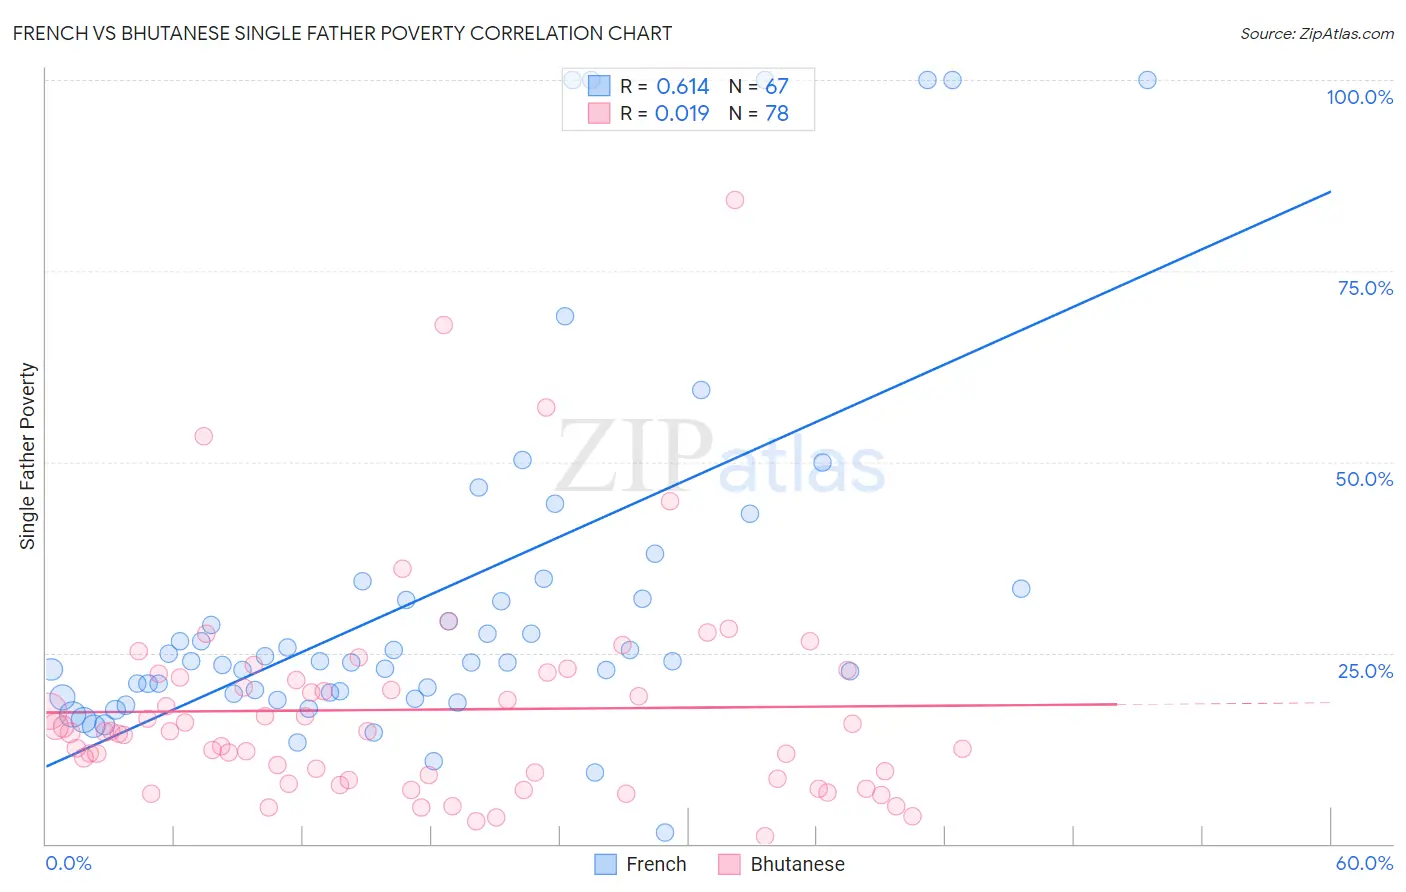
French vs Bhutanese Single Father Poverty Correlation Chart
The statistical analysis conducted on geographies consisting of 409,472,161 people shows a significant positive correlation between the proportion of French and poverty level among single fathers in the United States with a correlation coefficient (R) of 0.614 and weighted average of 18.2%. Similarly, the statistical analysis conducted on geographies consisting of 350,288,163 people shows no correlation between the proportion of Bhutanese and poverty level among single fathers in the United States with a correlation coefficient (R) of 0.019 and weighted average of 15.0%, a difference of 21.5%.
Single Father Poverty Correlation Summary
| Measurement | French | Bhutanese |
| Minimum | 1.4% | 0.92% |
| Maximum | 100.0% | 84.3% |
| Range | 98.6% | 83.3% |
| Mean | 32.5% | 17.6% |
| Median | 23.8% | 14.7% |
| Interquartile 25% (IQ1) | 19.7% | 8.5% |
| Interquartile 75% (IQ3) | 33.3% | 21.8% |
| Interquartile Range (IQR) | 13.7% | 13.3% |
| Standard Deviation (Sample) | 24.1% | 14.1% |
| Standard Deviation (Population) | 23.9% | 14.0% |
Similar Demographics by Single Father Poverty
Demographics Similar to French by Single Father Poverty
In terms of single father poverty, the demographic groups most similar to French are Seminole (18.1%, a difference of 0.21%), Yakama (18.1%, a difference of 0.31%), U.S. Virgin Islander (18.1%, a difference of 0.37%), Alaska Native (18.1%, a difference of 0.40%), and Immigrants from Bahamas (18.1%, a difference of 0.51%).
| Demographics | Rating | Rank | Single Father Poverty |
| West Indians | 0.0 /100 | #290 | Tragic 18.0% |
| Alaskan Athabascans | 0.0 /100 | #291 | Tragic 18.1% |
| Immigrants | Bahamas | 0.0 /100 | #292 | Tragic 18.1% |
| Alaska Natives | 0.0 /100 | #293 | Tragic 18.1% |
| U.S. Virgin Islanders | 0.0 /100 | #294 | Tragic 18.1% |
| Yakama | 0.0 /100 | #295 | Tragic 18.1% |
| Seminole | 0.0 /100 | #296 | Tragic 18.1% |
| French | 0.0 /100 | #297 | Tragic 18.2% |
| Africans | 0.0 /100 | #298 | Tragic 18.3% |
| Whites/Caucasians | 0.0 /100 | #299 | Tragic 18.4% |
| Immigrants | Dominican Republic | 0.0 /100 | #300 | Tragic 18.4% |
| Hungarians | 0.0 /100 | #301 | Tragic 18.5% |
| Comanche | 0.0 /100 | #302 | Tragic 18.5% |
| Celtics | 0.0 /100 | #303 | Tragic 18.5% |
| Ute | 0.0 /100 | #304 | Tragic 18.5% |
Demographics Similar to Bhutanese by Single Father Poverty
In terms of single father poverty, the demographic groups most similar to Bhutanese are Immigrants from Pakistan (15.0%, a difference of 0.020%), Immigrants from Eastern Asia (15.0%, a difference of 0.050%), Immigrants from El Salvador (15.0%, a difference of 0.060%), Immigrants from Kenya (15.0%, a difference of 0.090%), and Immigrants from China (14.9%, a difference of 0.21%).
| Demographics | Rating | Rank | Single Father Poverty |
| Immigrants | Eritrea | 100.0 /100 | #43 | Exceptional 14.8% |
| Salvadorans | 100.0 /100 | #44 | Exceptional 14.9% |
| Immigrants | Somalia | 100.0 /100 | #45 | Exceptional 14.9% |
| Immigrants | Cambodia | 99.9 /100 | #46 | Exceptional 14.9% |
| Immigrants | China | 99.9 /100 | #47 | Exceptional 14.9% |
| Malaysians | 99.9 /100 | #48 | Exceptional 14.9% |
| Immigrants | Eastern Asia | 99.9 /100 | #49 | Exceptional 15.0% |
| Bhutanese | 99.9 /100 | #50 | Exceptional 15.0% |
| Immigrants | Pakistan | 99.9 /100 | #51 | Exceptional 15.0% |
| Immigrants | El Salvador | 99.9 /100 | #52 | Exceptional 15.0% |
| Immigrants | Kenya | 99.9 /100 | #53 | Exceptional 15.0% |
| Immigrants | Uzbekistan | 99.9 /100 | #54 | Exceptional 15.0% |
| Immigrants | Bulgaria | 99.9 /100 | #55 | Exceptional 15.0% |
| Immigrants | Laos | 99.9 /100 | #56 | Exceptional 15.1% |
| Laotians | 99.9 /100 | #57 | Exceptional 15.1% |