French vs Alsatian Single Father Poverty
COMPARE
French
Alsatian
Single Father Poverty
Single Father Poverty Comparison
French
Alsatians
18.2%
SINGLE FATHER POVERTY
0.0/ 100
METRIC RATING
297th/ 347
METRIC RANK
17.8%
SINGLE FATHER POVERTY
0.0/ 100
METRIC RATING
283rd/ 347
METRIC RANK
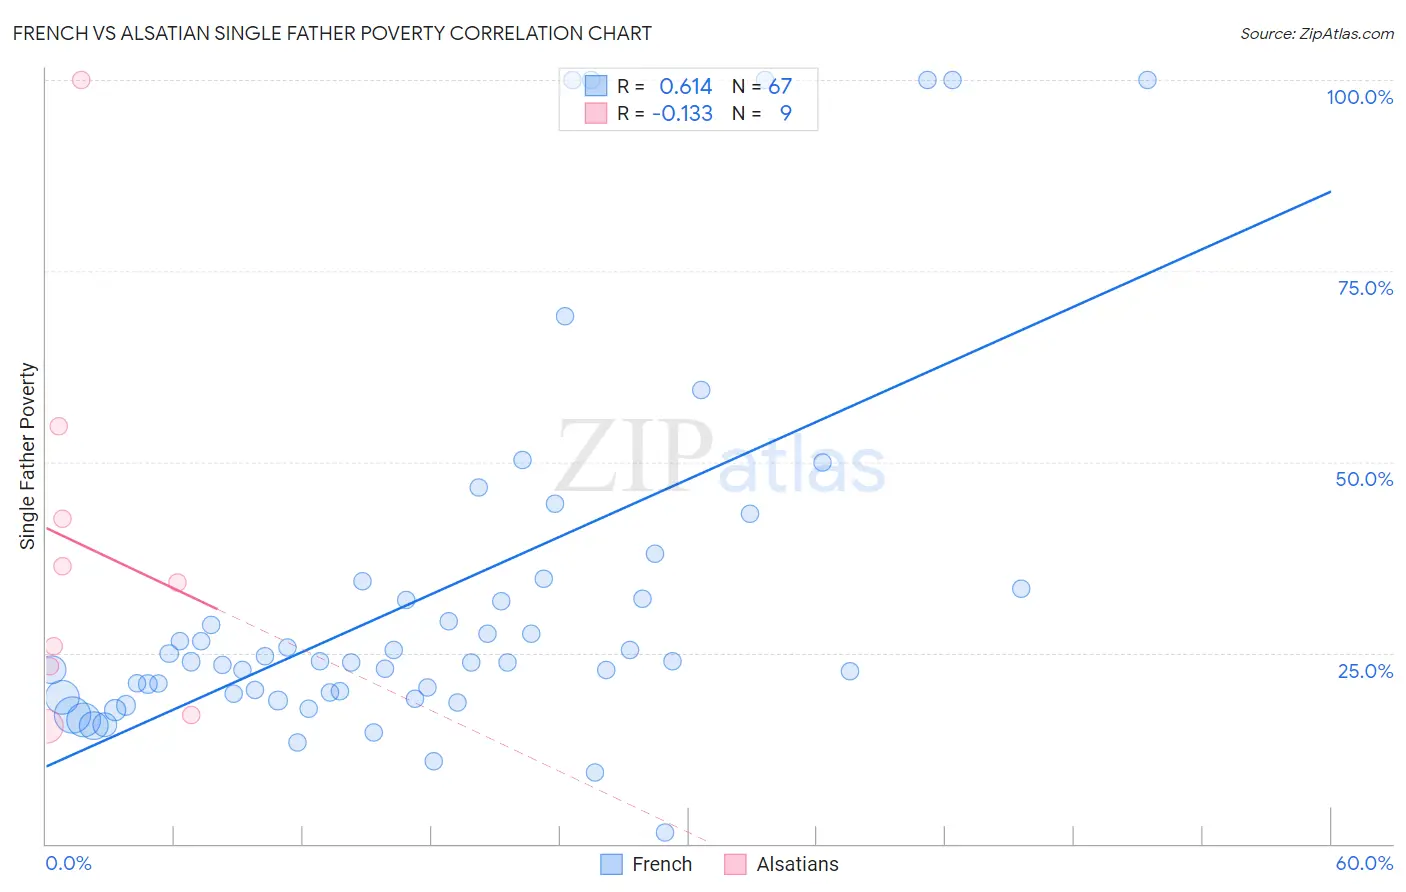
French vs Alsatian Single Father Poverty Correlation Chart
The statistical analysis conducted on geographies consisting of 409,472,161 people shows a significant positive correlation between the proportion of French and poverty level among single fathers in the United States with a correlation coefficient (R) of 0.614 and weighted average of 18.2%. Similarly, the statistical analysis conducted on geographies consisting of 73,758,627 people shows a poor negative correlation between the proportion of Alsatians and poverty level among single fathers in the United States with a correlation coefficient (R) of -0.133 and weighted average of 17.8%, a difference of 2.0%.
Single Father Poverty Correlation Summary
| Measurement | French | Alsatian |
| Minimum | 1.4% | 15.4% |
| Maximum | 100.0% | 100.0% |
| Range | 98.6% | 84.6% |
| Mean | 32.5% | 38.8% |
| Median | 23.8% | 34.2% |
| Interquartile 25% (IQ1) | 19.7% | 20.1% |
| Interquartile 75% (IQ3) | 33.3% | 48.6% |
| Interquartile Range (IQR) | 13.7% | 28.5% |
| Standard Deviation (Sample) | 24.1% | 26.2% |
| Standard Deviation (Population) | 23.9% | 24.7% |
Demographics Similar to French and Alsatians by Single Father Poverty
In terms of single father poverty, the demographic groups most similar to French are Seminole (18.1%, a difference of 0.21%), Yakama (18.1%, a difference of 0.31%), U.S. Virgin Islander (18.1%, a difference of 0.37%), Alaska Native (18.1%, a difference of 0.40%), and Immigrants from Bahamas (18.1%, a difference of 0.51%). Similarly, the demographic groups most similar to Alsatians are Welsh (17.8%, a difference of 0.020%), English (17.8%, a difference of 0.10%), Dutch (17.8%, a difference of 0.10%), Immigrants from Lebanon (17.9%, a difference of 0.38%), and Scottish (17.7%, a difference of 0.42%).
| Demographics | Rating | Rank | Single Father Poverty |
| Scottish | 0.0 /100 | #280 | Tragic 17.7% |
| English | 0.0 /100 | #281 | Tragic 17.8% |
| Dutch | 0.0 /100 | #282 | Tragic 17.8% |
| Alsatians | 0.0 /100 | #283 | Tragic 17.8% |
| Welsh | 0.0 /100 | #284 | Tragic 17.8% |
| Immigrants | Lebanon | 0.0 /100 | #285 | Tragic 17.9% |
| Immigrants | North Macedonia | 0.0 /100 | #286 | Tragic 17.9% |
| Carpatho Rusyns | 0.0 /100 | #287 | Tragic 18.0% |
| Bahamians | 0.0 /100 | #288 | Tragic 18.0% |
| Irish | 0.0 /100 | #289 | Tragic 18.0% |
| West Indians | 0.0 /100 | #290 | Tragic 18.0% |
| Alaskan Athabascans | 0.0 /100 | #291 | Tragic 18.1% |
| Immigrants | Bahamas | 0.0 /100 | #292 | Tragic 18.1% |
| Alaska Natives | 0.0 /100 | #293 | Tragic 18.1% |
| U.S. Virgin Islanders | 0.0 /100 | #294 | Tragic 18.1% |
| Yakama | 0.0 /100 | #295 | Tragic 18.1% |
| Seminole | 0.0 /100 | #296 | Tragic 18.1% |
| French | 0.0 /100 | #297 | Tragic 18.2% |
| Africans | 0.0 /100 | #298 | Tragic 18.3% |
| Whites/Caucasians | 0.0 /100 | #299 | Tragic 18.4% |
| Immigrants | Dominican Republic | 0.0 /100 | #300 | Tragic 18.4% |