French Canadian vs South American Child Poverty Under the Age of 16
COMPARE
French Canadian
South American
Child Poverty Under the Age of 16
Child Poverty Under the Age of 16 Comparison
French Canadians
South Americans
15.6%
CHILD POVERTY UNDER THE AGE OF 16
78.2/ 100
METRIC RATING
152nd/ 347
METRIC RANK
16.0%
CHILD POVERTY UNDER THE AGE OF 16
57.9/ 100
METRIC RATING
168th/ 347
METRIC RANK
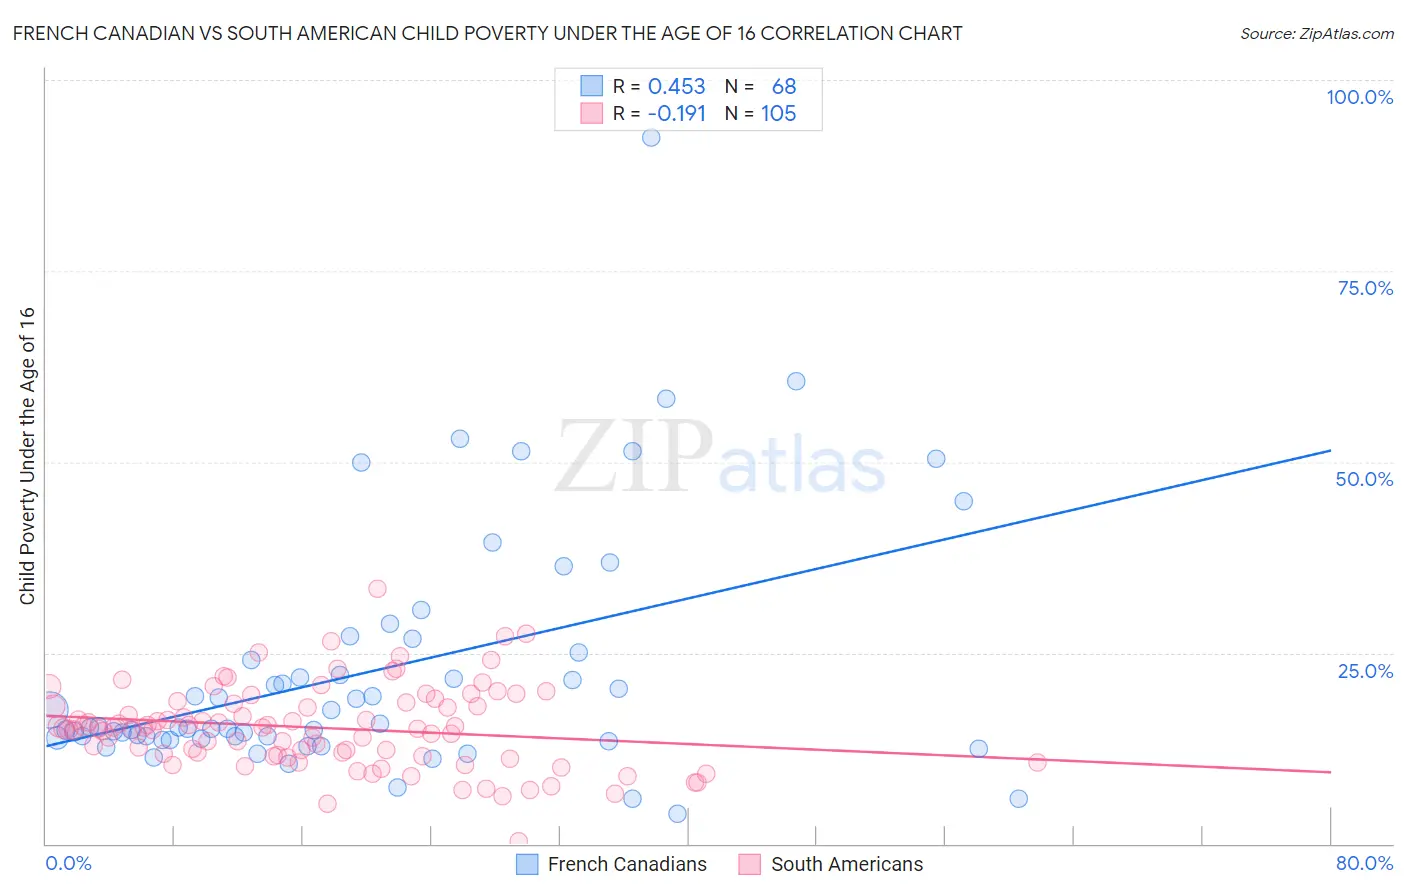
French Canadian vs South American Child Poverty Under the Age of 16 Correlation Chart
The statistical analysis conducted on geographies consisting of 494,388,455 people shows a moderate positive correlation between the proportion of French Canadians and poverty level among children under the age of 16 in the United States with a correlation coefficient (R) of 0.453 and weighted average of 15.6%. Similarly, the statistical analysis conducted on geographies consisting of 487,399,793 people shows a poor negative correlation between the proportion of South Americans and poverty level among children under the age of 16 in the United States with a correlation coefficient (R) of -0.191 and weighted average of 16.0%, a difference of 3.0%.
Child Poverty Under the Age of 16 Correlation Summary
| Measurement | French Canadian | South American |
| Minimum | 3.9% | 0.32% |
| Maximum | 92.5% | 33.3% |
| Range | 88.5% | 33.0% |
| Mean | 22.5% | 15.2% |
| Median | 15.3% | 15.1% |
| Interquartile 25% (IQ1) | 13.8% | 11.6% |
| Interquartile 75% (IQ3) | 24.5% | 18.4% |
| Interquartile Range (IQR) | 10.8% | 6.8% |
| Standard Deviation (Sample) | 15.9% | 5.4% |
| Standard Deviation (Population) | 15.8% | 5.4% |
Demographics Similar to French Canadians and South Americans by Child Poverty Under the Age of 16
In terms of child poverty under the age of 16, the demographic groups most similar to French Canadians are Immigrants from Jordan (15.6%, a difference of 0.040%), French (15.6%, a difference of 0.040%), Venezuelan (15.6%, a difference of 0.15%), Samoan (15.6%, a difference of 0.18%), and Syrian (15.6%, a difference of 0.38%). Similarly, the demographic groups most similar to South Americans are Costa Rican (16.0%, a difference of 0.40%), Uruguayan (16.1%, a difference of 0.40%), Immigrants from Colombia (16.1%, a difference of 0.43%), Immigrants from Oceania (15.9%, a difference of 0.97%), and Guamanian/Chamorro (15.9%, a difference of 1.1%).
| Demographics | Rating | Rank | Child Poverty Under the Age of 16 |
| Immigrants | Jordan | 78.5 /100 | #150 | Good 15.6% |
| French | 78.5 /100 | #151 | Good 15.6% |
| French Canadians | 78.2 /100 | #152 | Good 15.6% |
| Venezuelans | 77.4 /100 | #153 | Good 15.6% |
| Samoans | 77.3 /100 | #154 | Good 15.6% |
| Syrians | 76.1 /100 | #155 | Good 15.6% |
| Immigrants | Venezuela | 74.9 /100 | #156 | Good 15.7% |
| Immigrants | Nepal | 72.9 /100 | #157 | Good 15.7% |
| Immigrants | Chile | 72.8 /100 | #158 | Good 15.7% |
| Immigrants | Fiji | 71.1 /100 | #159 | Good 15.8% |
| Immigrants | Albania | 70.7 /100 | #160 | Good 15.8% |
| Immigrants | Northern Africa | 68.1 /100 | #161 | Good 15.8% |
| Colombians | 67.6 /100 | #162 | Good 15.8% |
| Yugoslavians | 67.6 /100 | #163 | Good 15.8% |
| Immigrants | Germany | 67.3 /100 | #164 | Good 15.8% |
| Guamanians/Chamorros | 66.4 /100 | #165 | Good 15.9% |
| Immigrants | Oceania | 65.4 /100 | #166 | Good 15.9% |
| Costa Ricans | 61.1 /100 | #167 | Good 16.0% |
| South Americans | 57.9 /100 | #168 | Average 16.0% |
| Uruguayans | 54.7 /100 | #169 | Average 16.1% |
| Immigrants | Colombia | 54.4 /100 | #170 | Average 16.1% |