French Canadian vs Nicaraguan Child Poverty Under the Age of 16
COMPARE
French Canadian
Nicaraguan
Child Poverty Under the Age of 16
Child Poverty Under the Age of 16 Comparison
French Canadians
Nicaraguans
15.6%
CHILD POVERTY UNDER THE AGE OF 16
78.2/ 100
METRIC RATING
152nd/ 347
METRIC RANK
18.2%
CHILD POVERTY UNDER THE AGE OF 16
1.7/ 100
METRIC RATING
231st/ 347
METRIC RANK
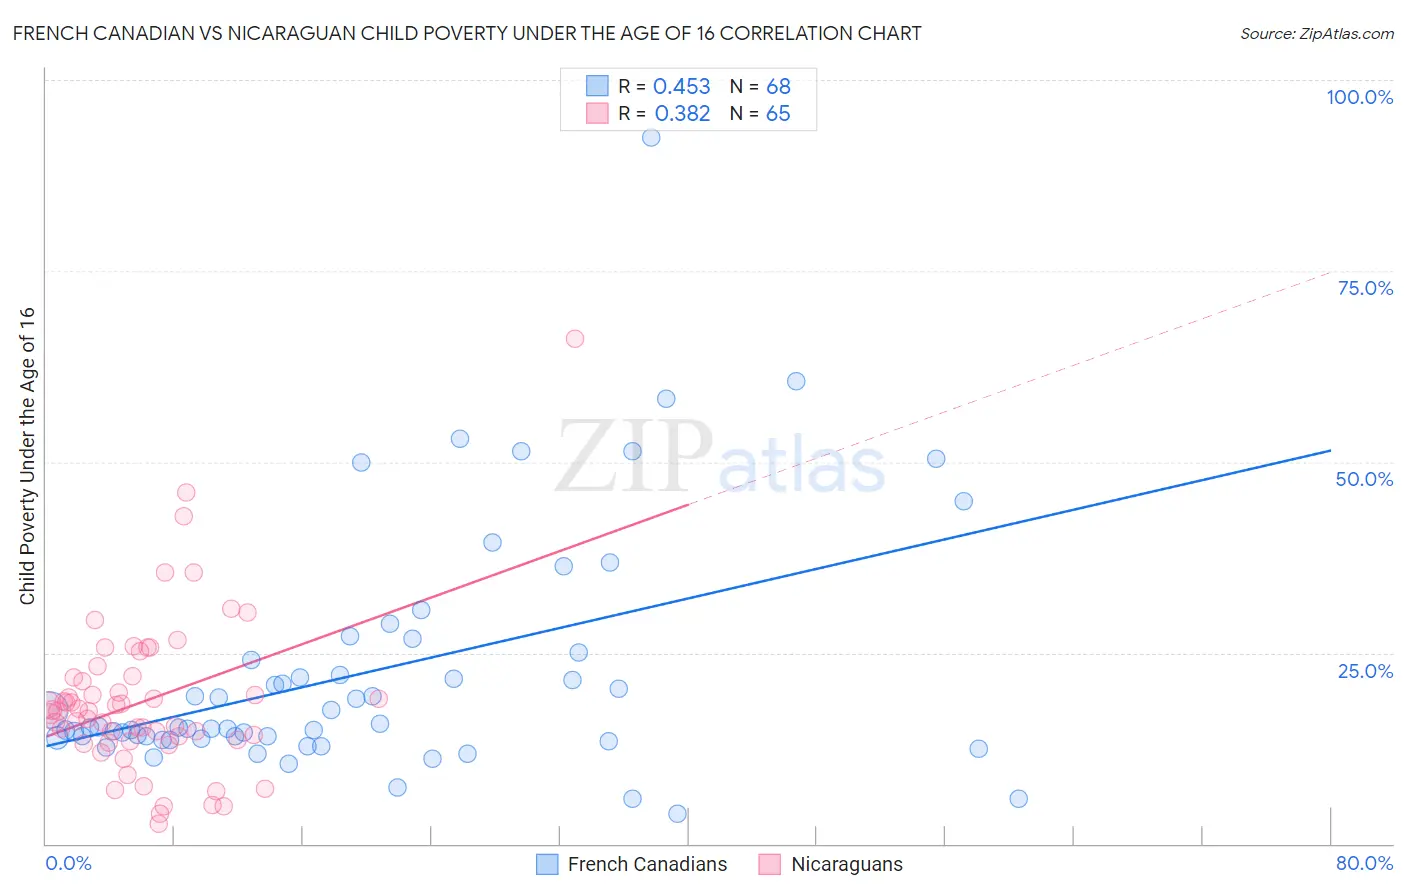
French Canadian vs Nicaraguan Child Poverty Under the Age of 16 Correlation Chart
The statistical analysis conducted on geographies consisting of 494,388,455 people shows a moderate positive correlation between the proportion of French Canadians and poverty level among children under the age of 16 in the United States with a correlation coefficient (R) of 0.453 and weighted average of 15.6%. Similarly, the statistical analysis conducted on geographies consisting of 284,786,124 people shows a mild positive correlation between the proportion of Nicaraguans and poverty level among children under the age of 16 in the United States with a correlation coefficient (R) of 0.382 and weighted average of 18.2%, a difference of 16.7%.
Child Poverty Under the Age of 16 Correlation Summary
| Measurement | French Canadian | Nicaraguan |
| Minimum | 3.9% | 2.6% |
| Maximum | 92.5% | 66.2% |
| Range | 88.5% | 63.6% |
| Mean | 22.5% | 18.7% |
| Median | 15.3% | 17.4% |
| Interquartile 25% (IQ1) | 13.8% | 13.5% |
| Interquartile 75% (IQ3) | 24.5% | 21.8% |
| Interquartile Range (IQR) | 10.8% | 8.3% |
| Standard Deviation (Sample) | 15.9% | 10.4% |
| Standard Deviation (Population) | 15.8% | 10.4% |
Similar Demographics by Child Poverty Under the Age of 16
Demographics Similar to French Canadians by Child Poverty Under the Age of 16
In terms of child poverty under the age of 16, the demographic groups most similar to French Canadians are Immigrants from Jordan (15.6%, a difference of 0.040%), French (15.6%, a difference of 0.040%), Venezuelan (15.6%, a difference of 0.15%), Samoan (15.6%, a difference of 0.18%), and Israeli (15.5%, a difference of 0.36%).
| Demographics | Rating | Rank | Child Poverty Under the Age of 16 |
| Immigrants | Peru | 81.7 /100 | #145 | Excellent 15.5% |
| Slovaks | 81.4 /100 | #146 | Excellent 15.5% |
| Immigrants | Kuwait | 80.5 /100 | #147 | Excellent 15.5% |
| Puget Sound Salish | 80.3 /100 | #148 | Excellent 15.5% |
| Israelis | 80.1 /100 | #149 | Excellent 15.5% |
| Immigrants | Jordan | 78.5 /100 | #150 | Good 15.6% |
| French | 78.5 /100 | #151 | Good 15.6% |
| French Canadians | 78.2 /100 | #152 | Good 15.6% |
| Venezuelans | 77.4 /100 | #153 | Good 15.6% |
| Samoans | 77.3 /100 | #154 | Good 15.6% |
| Syrians | 76.1 /100 | #155 | Good 15.6% |
| Immigrants | Venezuela | 74.9 /100 | #156 | Good 15.7% |
| Immigrants | Nepal | 72.9 /100 | #157 | Good 15.7% |
| Immigrants | Chile | 72.8 /100 | #158 | Good 15.7% |
| Immigrants | Fiji | 71.1 /100 | #159 | Good 15.8% |
Demographics Similar to Nicaraguans by Child Poverty Under the Age of 16
In terms of child poverty under the age of 16, the demographic groups most similar to Nicaraguans are Nepalese (18.2%, a difference of 0.060%), Marshallese (18.1%, a difference of 0.14%), Immigrants from Micronesia (18.0%, a difference of 0.87%), American (18.3%, a difference of 0.90%), and Immigrants from Africa (18.0%, a difference of 1.0%).
| Demographics | Rating | Rank | Child Poverty Under the Age of 16 |
| Osage | 3.1 /100 | #224 | Tragic 17.9% |
| Immigrants | Nonimmigrants | 2.7 /100 | #225 | Tragic 17.9% |
| Bermudans | 2.6 /100 | #226 | Tragic 18.0% |
| Immigrants | Africa | 2.5 /100 | #227 | Tragic 18.0% |
| Immigrants | Micronesia | 2.3 /100 | #228 | Tragic 18.0% |
| Marshallese | 1.8 /100 | #229 | Tragic 18.1% |
| Nepalese | 1.7 /100 | #230 | Tragic 18.2% |
| Nicaraguans | 1.7 /100 | #231 | Tragic 18.2% |
| Americans | 1.2 /100 | #232 | Tragic 18.3% |
| Fijians | 1.1 /100 | #233 | Tragic 18.4% |
| Immigrants | Nigeria | 1.0 /100 | #234 | Tragic 18.4% |
| Nigerians | 1.0 /100 | #235 | Tragic 18.4% |
| Cree | 0.9 /100 | #236 | Tragic 18.5% |
| Sudanese | 0.9 /100 | #237 | Tragic 18.5% |
| Immigrants | Eritrea | 0.8 /100 | #238 | Tragic 18.5% |