French American Indian vs Immigrants from Kuwait Poverty
COMPARE
French American Indian
Immigrants from Kuwait
Poverty
Poverty Comparison
French American Indians
Immigrants from Kuwait
13.9%
POVERTY
0.5/ 100
METRIC RATING
237th/ 347
METRIC RANK
12.7%
POVERTY
20.9/ 100
METRIC RATING
195th/ 347
METRIC RANK
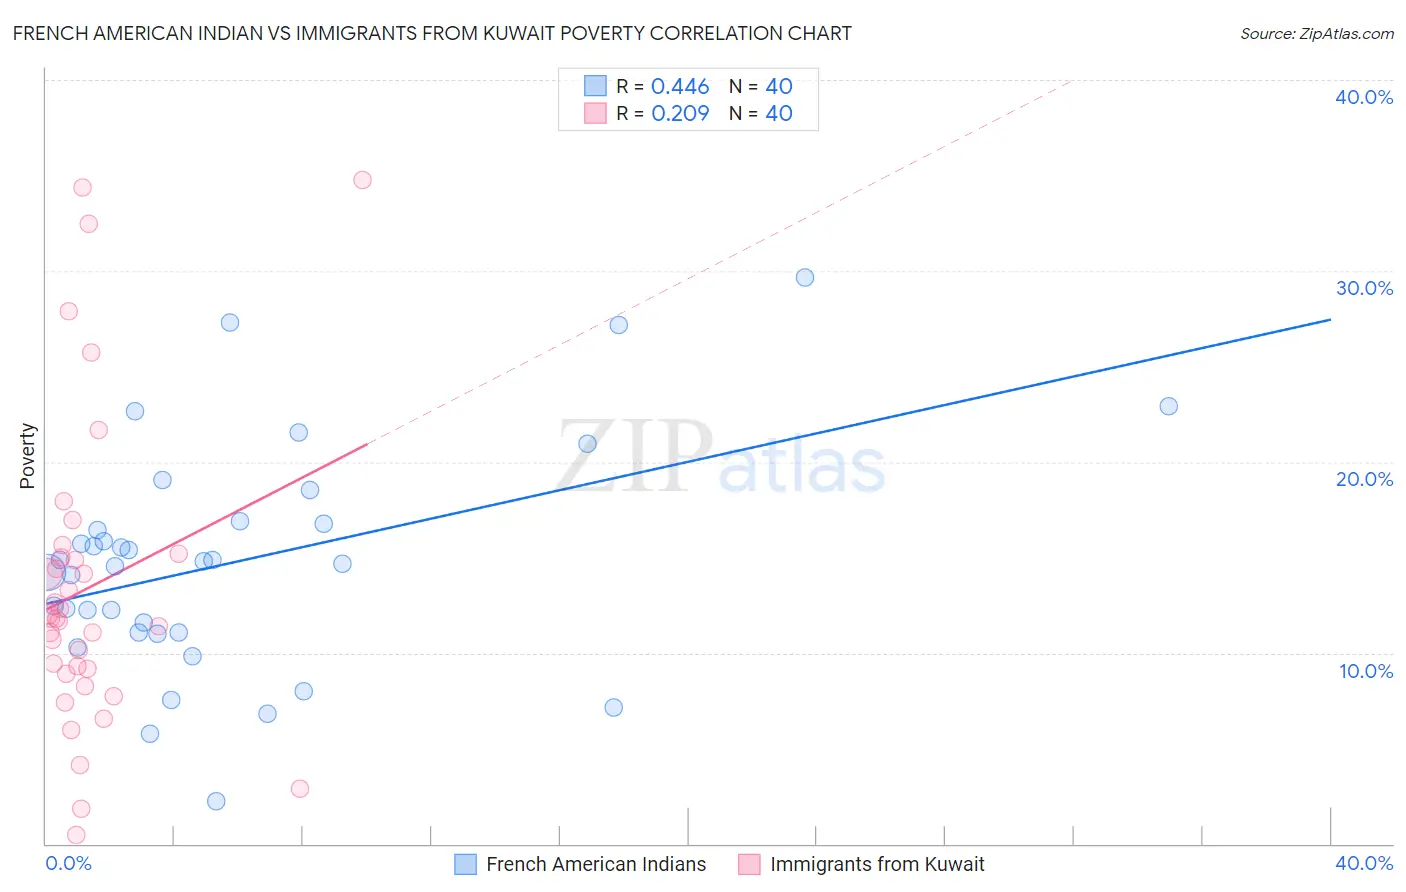
French American Indian vs Immigrants from Kuwait Poverty Correlation Chart
The statistical analysis conducted on geographies consisting of 131,970,723 people shows a moderate positive correlation between the proportion of French American Indians and poverty level in the United States with a correlation coefficient (R) of 0.446 and weighted average of 13.9%. Similarly, the statistical analysis conducted on geographies consisting of 136,889,651 people shows a weak positive correlation between the proportion of Immigrants from Kuwait and poverty level in the United States with a correlation coefficient (R) of 0.209 and weighted average of 12.7%, a difference of 9.1%.
Poverty Correlation Summary
| Measurement | French American Indian | Immigrants from Kuwait |
| Minimum | 2.2% | 0.47% |
| Maximum | 29.6% | 34.8% |
| Range | 27.4% | 34.3% |
| Mean | 14.8% | 13.4% |
| Median | 14.7% | 11.8% |
| Interquartile 25% (IQ1) | 11.0% | 9.0% |
| Interquartile 75% (IQ3) | 16.8% | 15.1% |
| Interquartile Range (IQR) | 5.8% | 6.1% |
| Standard Deviation (Sample) | 5.9% | 8.1% |
| Standard Deviation (Population) | 5.9% | 8.0% |
Similar Demographics by Poverty
Demographics Similar to French American Indians by Poverty
In terms of poverty, the demographic groups most similar to French American Indians are Immigrants from Armenia (13.9%, a difference of 0.020%), Cuban (13.9%, a difference of 0.060%), Ghanaian (13.9%, a difference of 0.13%), Nicaraguan (13.9%, a difference of 0.48%), and Immigrants from Laos (13.8%, a difference of 0.49%).
| Demographics | Rating | Rank | Poverty |
| Alaskan Athabascans | 1.5 /100 | #230 | Tragic 13.6% |
| Nigerians | 1.4 /100 | #231 | Tragic 13.6% |
| Fijians | 0.8 /100 | #232 | Tragic 13.7% |
| Immigrants | Saudi Arabia | 0.8 /100 | #233 | Tragic 13.8% |
| Immigrants | Laos | 0.7 /100 | #234 | Tragic 13.8% |
| Cubans | 0.6 /100 | #235 | Tragic 13.9% |
| Immigrants | Armenia | 0.5 /100 | #236 | Tragic 13.9% |
| French American Indians | 0.5 /100 | #237 | Tragic 13.9% |
| Ghanaians | 0.5 /100 | #238 | Tragic 13.9% |
| Nicaraguans | 0.4 /100 | #239 | Tragic 13.9% |
| Immigrants | Middle Africa | 0.4 /100 | #240 | Tragic 14.0% |
| Salvadorans | 0.4 /100 | #241 | Tragic 14.0% |
| Ecuadorians | 0.4 /100 | #242 | Tragic 14.0% |
| Sudanese | 0.3 /100 | #243 | Tragic 14.0% |
| Nepalese | 0.3 /100 | #244 | Tragic 14.0% |
Demographics Similar to Immigrants from Kuwait by Poverty
In terms of poverty, the demographic groups most similar to Immigrants from Kuwait are Iraqi (12.7%, a difference of 0.020%), Arab (12.7%, a difference of 0.030%), Delaware (12.7%, a difference of 0.080%), Immigrants from Lebanon (12.8%, a difference of 0.32%), and South American Indian (12.7%, a difference of 0.33%).
| Demographics | Rating | Rank | Poverty |
| Immigrants | Costa Rica | 33.3 /100 | #188 | Fair 12.5% |
| Aleuts | 33.2 /100 | #189 | Fair 12.5% |
| Immigrants | South America | 32.3 /100 | #190 | Fair 12.5% |
| Sierra Leoneans | 31.5 /100 | #191 | Fair 12.6% |
| South American Indians | 23.3 /100 | #192 | Fair 12.7% |
| Delaware | 21.4 /100 | #193 | Fair 12.7% |
| Arabs | 21.1 /100 | #194 | Fair 12.7% |
| Immigrants | Kuwait | 20.9 /100 | #195 | Fair 12.7% |
| Iraqis | 20.8 /100 | #196 | Fair 12.7% |
| Immigrants | Lebanon | 18.7 /100 | #197 | Poor 12.8% |
| Spanish | 18.7 /100 | #198 | Poor 12.8% |
| Immigrants | Kenya | 17.5 /100 | #199 | Poor 12.8% |
| Spaniards | 16.5 /100 | #200 | Poor 12.8% |
| Immigrants | Uganda | 16.5 /100 | #201 | Poor 12.8% |
| Immigrants | Uruguay | 15.6 /100 | #202 | Poor 12.8% |