Finnish vs Immigrants from Saudi Arabia Single Mother Poverty
COMPARE
Finnish
Immigrants from Saudi Arabia
Single Mother Poverty
Single Mother Poverty Comparison
Finns
Immigrants from Saudi Arabia
30.0%
SINGLE MOTHER POVERTY
9.3/ 100
METRIC RATING
219th/ 347
METRIC RANK
29.2%
SINGLE MOTHER POVERTY
50.0/ 100
METRIC RATING
174th/ 347
METRIC RANK
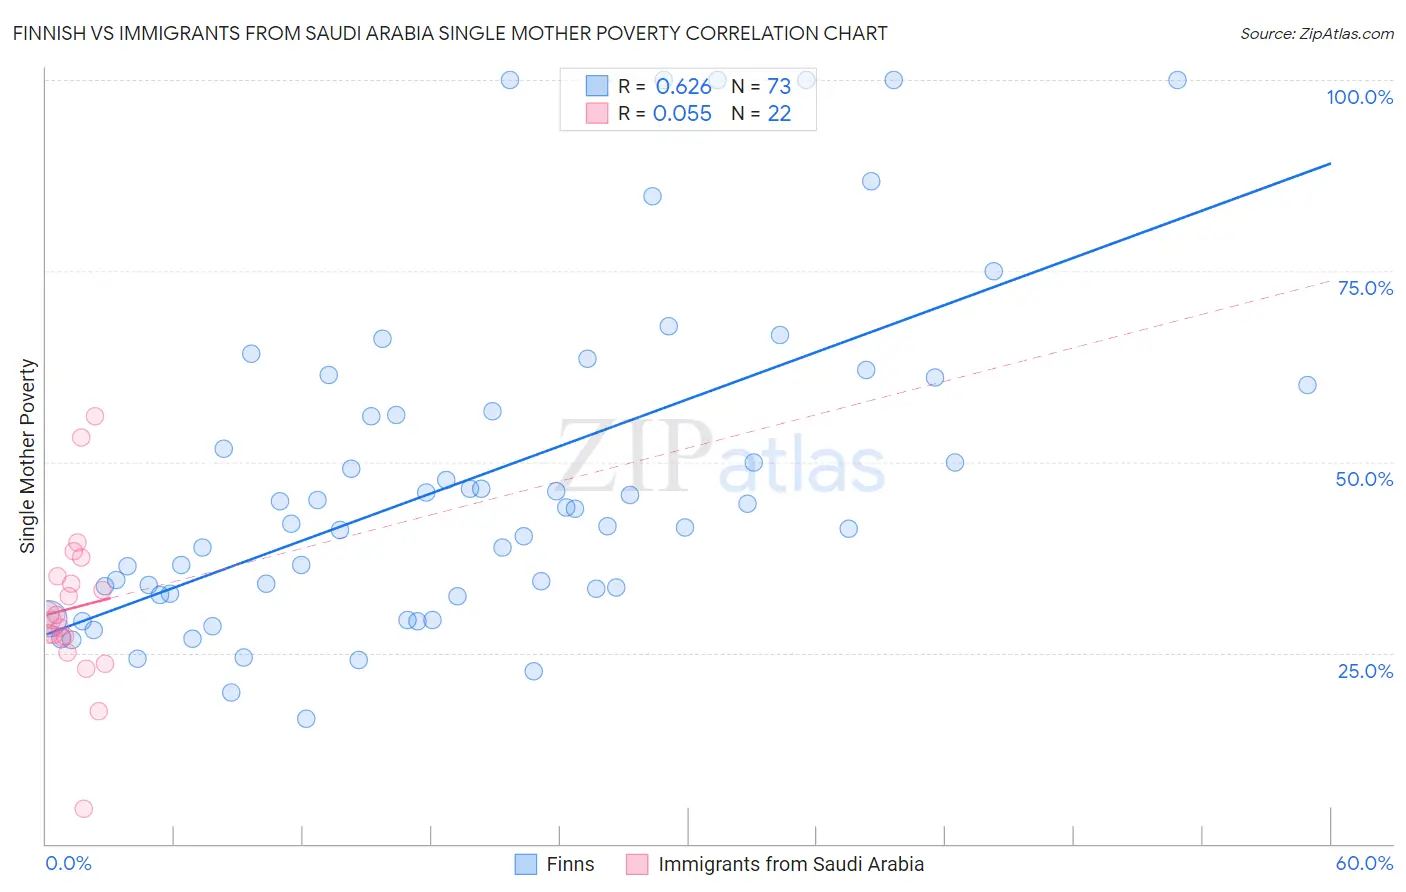
Finnish vs Immigrants from Saudi Arabia Single Mother Poverty Correlation Chart
The statistical analysis conducted on geographies consisting of 392,432,308 people shows a significant positive correlation between the proportion of Finns and poverty level among single mothers in the United States with a correlation coefficient (R) of 0.626 and weighted average of 30.0%. Similarly, the statistical analysis conducted on geographies consisting of 162,874,367 people shows a slight positive correlation between the proportion of Immigrants from Saudi Arabia and poverty level among single mothers in the United States with a correlation coefficient (R) of 0.055 and weighted average of 29.2%, a difference of 2.7%.
Single Mother Poverty Correlation Summary
| Measurement | Finnish | Immigrants from Saudi Arabia |
| Minimum | 16.4% | 4.6% |
| Maximum | 100.0% | 56.0% |
| Range | 83.6% | 51.3% |
| Mean | 47.6% | 30.9% |
| Median | 42.0% | 29.6% |
| Interquartile 25% (IQ1) | 32.7% | 27.0% |
| Interquartile 75% (IQ3) | 58.3% | 35.0% |
| Interquartile Range (IQR) | 25.6% | 8.0% |
| Standard Deviation (Sample) | 21.5% | 10.7% |
| Standard Deviation (Population) | 21.4% | 10.5% |
Similar Demographics by Single Mother Poverty
Demographics Similar to Finns by Single Mother Poverty
In terms of single mother poverty, the demographic groups most similar to Finns are German (30.0%, a difference of 0.070%), Hungarian (29.9%, a difference of 0.14%), Immigrants from Ghana (29.9%, a difference of 0.25%), Immigrants from Eritrea (30.0%, a difference of 0.25%), and Sudanese (30.0%, a difference of 0.25%).
| Demographics | Rating | Rank | Single Mother Poverty |
| Nicaraguans | 12.4 /100 | #212 | Poor 29.8% |
| Immigrants | Thailand | 12.0 /100 | #213 | Poor 29.9% |
| Liberians | 11.7 /100 | #214 | Poor 29.9% |
| Jamaicans | 11.7 /100 | #215 | Poor 29.9% |
| Immigrants | Western Africa | 11.5 /100 | #216 | Poor 29.9% |
| Immigrants | Ghana | 11.3 /100 | #217 | Poor 29.9% |
| Hungarians | 10.3 /100 | #218 | Poor 29.9% |
| Finns | 9.3 /100 | #219 | Tragic 30.0% |
| Germans | 8.8 /100 | #220 | Tragic 30.0% |
| Immigrants | Eritrea | 7.7 /100 | #221 | Tragic 30.0% |
| Sudanese | 7.6 /100 | #222 | Tragic 30.0% |
| Immigrants | Cuba | 6.9 /100 | #223 | Tragic 30.1% |
| Immigrants | Sudan | 6.5 /100 | #224 | Tragic 30.1% |
| Spanish | 6.3 /100 | #225 | Tragic 30.1% |
| Scottish | 6.0 /100 | #226 | Tragic 30.1% |
Demographics Similar to Immigrants from Saudi Arabia by Single Mother Poverty
In terms of single mother poverty, the demographic groups most similar to Immigrants from Saudi Arabia are British (29.2%, a difference of 0.030%), Immigrants from Costa Rica (29.2%, a difference of 0.060%), Hawaiian (29.2%, a difference of 0.10%), Carpatho Rusyn (29.1%, a difference of 0.18%), and Immigrants from Bosnia and Herzegovina (29.2%, a difference of 0.23%).
| Demographics | Rating | Rank | Single Mother Poverty |
| Costa Ricans | 58.4 /100 | #167 | Average 29.0% |
| Europeans | 57.6 /100 | #168 | Average 29.1% |
| Immigrants | Uruguay | 57.2 /100 | #169 | Average 29.1% |
| New Zealanders | 55.1 /100 | #170 | Average 29.1% |
| Puget Sound Salish | 55.1 /100 | #171 | Average 29.1% |
| Carpatho Rusyns | 53.8 /100 | #172 | Average 29.1% |
| British | 50.6 /100 | #173 | Average 29.2% |
| Immigrants | Saudi Arabia | 50.0 /100 | #174 | Average 29.2% |
| Immigrants | Costa Rica | 48.8 /100 | #175 | Average 29.2% |
| Hawaiians | 47.8 /100 | #176 | Average 29.2% |
| Immigrants | Bosnia and Herzegovina | 45.1 /100 | #177 | Average 29.2% |
| South American Indians | 43.2 /100 | #178 | Average 29.3% |
| Immigrants | Uzbekistan | 42.6 /100 | #179 | Average 29.3% |
| Immigrants | Norway | 41.5 /100 | #180 | Average 29.3% |
| Canadians | 40.4 /100 | #181 | Average 29.3% |