Filipino vs Immigrants from Scotland Single Male Poverty
COMPARE
Filipino
Immigrants from Scotland
Single Male Poverty
Single Male Poverty Comparison
Filipinos
Immigrants from Scotland
10.6%
SINGLE MALE POVERTY
100.0/ 100
METRIC RATING
6th/ 347
METRIC RANK
12.7%
SINGLE MALE POVERTY
68.9/ 100
METRIC RATING
154th/ 347
METRIC RANK
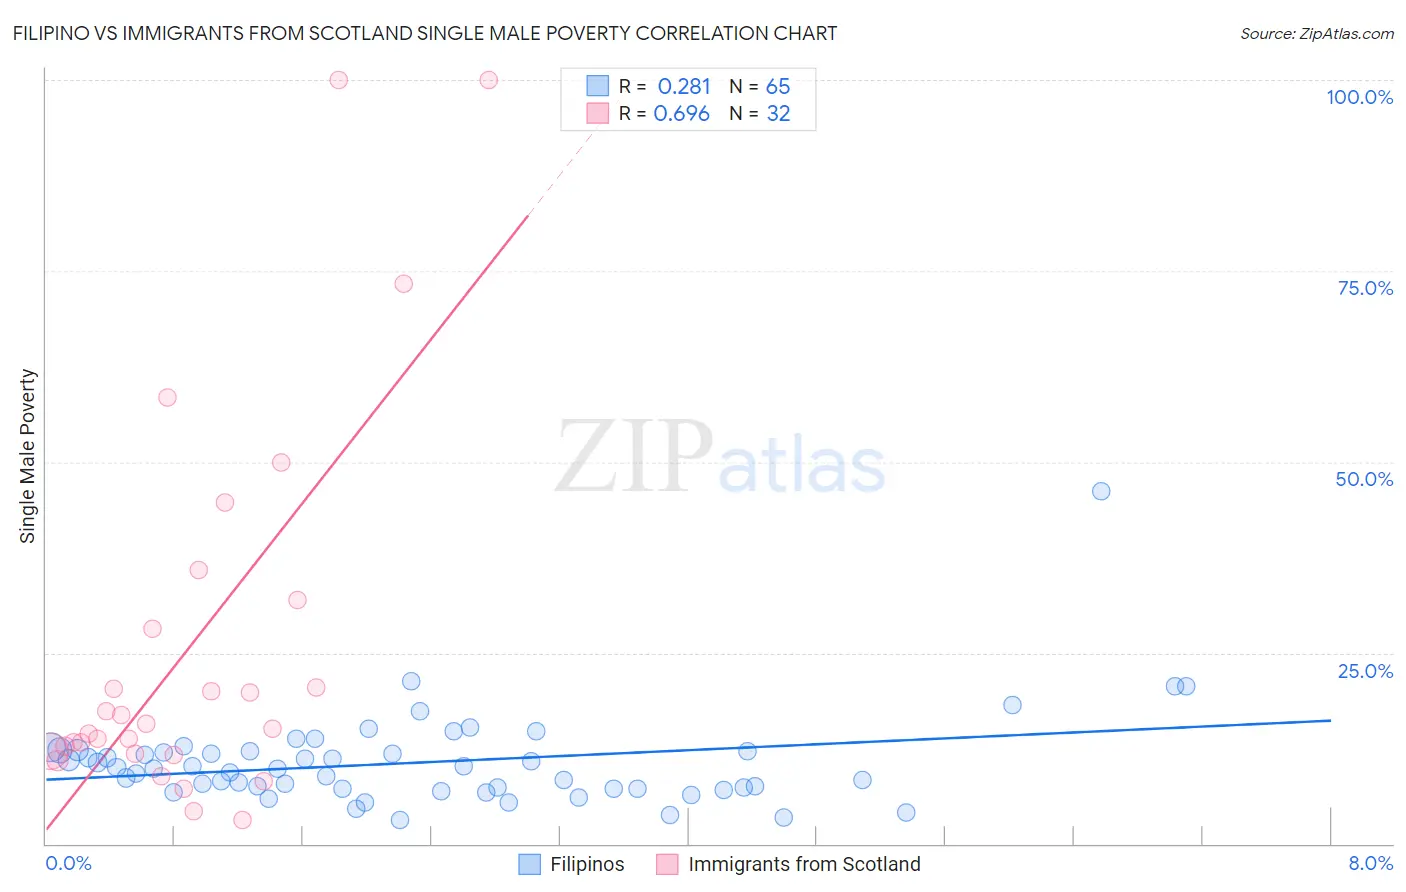
Filipino vs Immigrants from Scotland Single Male Poverty Correlation Chart
The statistical analysis conducted on geographies consisting of 229,961,991 people shows a weak positive correlation between the proportion of Filipinos and poverty level among single males in the United States with a correlation coefficient (R) of 0.281 and weighted average of 10.6%. Similarly, the statistical analysis conducted on geographies consisting of 179,195,649 people shows a significant positive correlation between the proportion of Immigrants from Scotland and poverty level among single males in the United States with a correlation coefficient (R) of 0.696 and weighted average of 12.7%, a difference of 19.2%.
Single Male Poverty Correlation Summary
| Measurement | Filipino | Immigrants from Scotland |
| Minimum | 3.1% | 3.1% |
| Maximum | 46.2% | 100.0% |
| Range | 43.1% | 96.9% |
| Mean | 10.6% | 25.8% |
| Median | 9.8% | 15.4% |
| Interquartile 25% (IQ1) | 7.2% | 11.9% |
| Interquartile 75% (IQ3) | 12.2% | 30.0% |
| Interquartile Range (IQR) | 4.9% | 18.1% |
| Standard Deviation (Sample) | 6.0% | 25.1% |
| Standard Deviation (Population) | 6.0% | 24.7% |
Similar Demographics by Single Male Poverty
Demographics Similar to Filipinos by Single Male Poverty
In terms of single male poverty, the demographic groups most similar to Filipinos are Afghan (10.7%, a difference of 0.75%), Thai (10.8%, a difference of 1.2%), Tongan (10.5%, a difference of 1.7%), Immigrants from Hong Kong (10.4%, a difference of 1.7%), and Taiwanese (10.9%, a difference of 2.5%).
| Demographics | Rating | Rank | Single Male Poverty |
| Assyrians/Chaldeans/Syriacs | 100.0 /100 | #1 | Exceptional 9.8% |
| Immigrants | Taiwan | 100.0 /100 | #2 | Exceptional 10.3% |
| Immigrants | India | 100.0 /100 | #3 | Exceptional 10.3% |
| Immigrants | Hong Kong | 100.0 /100 | #4 | Exceptional 10.4% |
| Tongans | 100.0 /100 | #5 | Exceptional 10.5% |
| Filipinos | 100.0 /100 | #6 | Exceptional 10.6% |
| Afghans | 100.0 /100 | #7 | Exceptional 10.7% |
| Thais | 100.0 /100 | #8 | Exceptional 10.8% |
| Taiwanese | 100.0 /100 | #9 | Exceptional 10.9% |
| Immigrants | Fiji | 100.0 /100 | #10 | Exceptional 10.9% |
| Immigrants | Philippines | 100.0 /100 | #11 | Exceptional 10.9% |
| Immigrants | Afghanistan | 100.0 /100 | #12 | Exceptional 10.9% |
| Immigrants | South Central Asia | 100.0 /100 | #13 | Exceptional 10.9% |
| Chinese | 100.0 /100 | #14 | Exceptional 11.0% |
| Koreans | 100.0 /100 | #15 | Exceptional 11.0% |
Demographics Similar to Immigrants from Scotland by Single Male Poverty
In terms of single male poverty, the demographic groups most similar to Immigrants from Scotland are Immigrants from Spain (12.7%, a difference of 0.020%), Vietnamese (12.7%, a difference of 0.060%), Latvian (12.7%, a difference of 0.060%), Immigrants (12.7%, a difference of 0.070%), and Australian (12.6%, a difference of 0.16%).
| Demographics | Rating | Rank | Single Male Poverty |
| Malaysians | 74.8 /100 | #147 | Good 12.6% |
| Yugoslavians | 73.9 /100 | #148 | Good 12.6% |
| Sierra Leoneans | 73.0 /100 | #149 | Good 12.6% |
| Immigrants | Panama | 72.1 /100 | #150 | Good 12.6% |
| Immigrants | Hungary | 71.9 /100 | #151 | Good 12.6% |
| Australians | 71.4 /100 | #152 | Good 12.6% |
| Immigrants | Immigrants | 70.1 /100 | #153 | Good 12.7% |
| Immigrants | Scotland | 68.9 /100 | #154 | Good 12.7% |
| Immigrants | Spain | 68.7 /100 | #155 | Good 12.7% |
| Vietnamese | 67.9 /100 | #156 | Good 12.7% |
| Latvians | 67.9 /100 | #157 | Good 12.7% |
| Immigrants | Middle Africa | 64.9 /100 | #158 | Good 12.7% |
| Immigrants | Liberia | 64.2 /100 | #159 | Good 12.7% |
| Greeks | 64.1 /100 | #160 | Good 12.7% |
| Immigrants | Africa | 63.4 /100 | #161 | Good 12.7% |