Filipino vs Barbadian Single Male Poverty
COMPARE
Filipino
Barbadian
Single Male Poverty
Single Male Poverty Comparison
Filipinos
Barbadians
10.6%
SINGLE MALE POVERTY
100.0/ 100
METRIC RATING
6th/ 347
METRIC RANK
13.4%
SINGLE MALE POVERTY
2.1/ 100
METRIC RATING
243rd/ 347
METRIC RANK
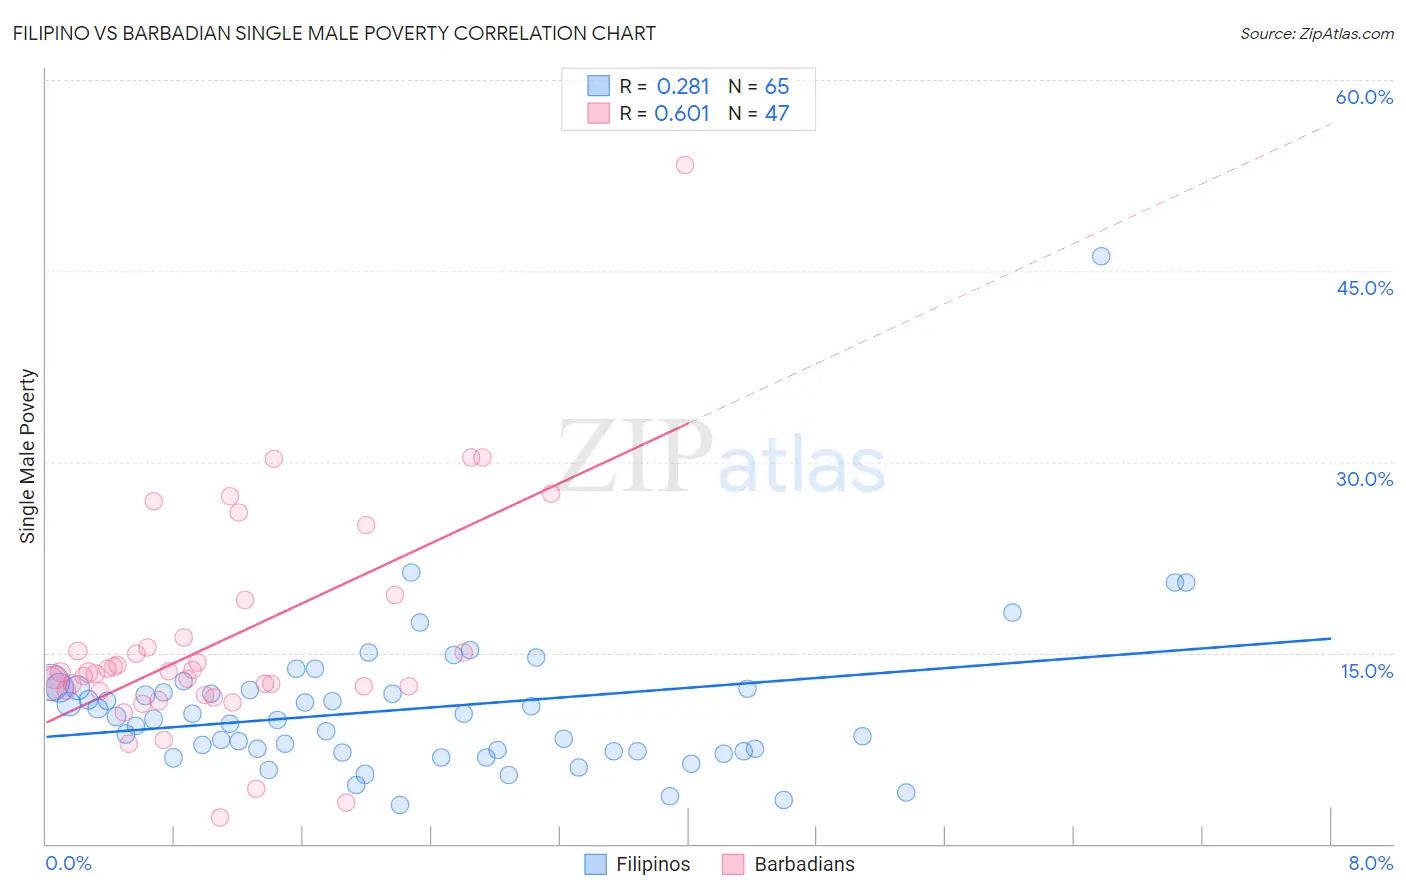
Filipino vs Barbadian Single Male Poverty Correlation Chart
The statistical analysis conducted on geographies consisting of 229,961,991 people shows a weak positive correlation between the proportion of Filipinos and poverty level among single males in the United States with a correlation coefficient (R) of 0.281 and weighted average of 10.6%. Similarly, the statistical analysis conducted on geographies consisting of 135,240,511 people shows a significant positive correlation between the proportion of Barbadians and poverty level among single males in the United States with a correlation coefficient (R) of 0.601 and weighted average of 13.4%, a difference of 26.6%.
Single Male Poverty Correlation Summary
| Measurement | Filipino | Barbadian |
| Minimum | 3.1% | 2.0% |
| Maximum | 46.2% | 53.3% |
| Range | 43.1% | 51.3% |
| Mean | 10.6% | 15.9% |
| Median | 9.8% | 13.4% |
| Interquartile 25% (IQ1) | 7.2% | 12.0% |
| Interquartile 75% (IQ3) | 12.2% | 16.2% |
| Interquartile Range (IQR) | 4.9% | 4.2% |
| Standard Deviation (Sample) | 6.0% | 8.8% |
| Standard Deviation (Population) | 6.0% | 8.7% |
Similar Demographics by Single Male Poverty
Demographics Similar to Filipinos by Single Male Poverty
In terms of single male poverty, the demographic groups most similar to Filipinos are Afghan (10.7%, a difference of 0.75%), Thai (10.8%, a difference of 1.2%), Tongan (10.5%, a difference of 1.7%), Immigrants from Hong Kong (10.4%, a difference of 1.7%), and Taiwanese (10.9%, a difference of 2.5%).
| Demographics | Rating | Rank | Single Male Poverty |
| Assyrians/Chaldeans/Syriacs | 100.0 /100 | #1 | Exceptional 9.8% |
| Immigrants | Taiwan | 100.0 /100 | #2 | Exceptional 10.3% |
| Immigrants | India | 100.0 /100 | #3 | Exceptional 10.3% |
| Immigrants | Hong Kong | 100.0 /100 | #4 | Exceptional 10.4% |
| Tongans | 100.0 /100 | #5 | Exceptional 10.5% |
| Filipinos | 100.0 /100 | #6 | Exceptional 10.6% |
| Afghans | 100.0 /100 | #7 | Exceptional 10.7% |
| Thais | 100.0 /100 | #8 | Exceptional 10.8% |
| Taiwanese | 100.0 /100 | #9 | Exceptional 10.9% |
| Immigrants | Fiji | 100.0 /100 | #10 | Exceptional 10.9% |
| Immigrants | Philippines | 100.0 /100 | #11 | Exceptional 10.9% |
| Immigrants | Afghanistan | 100.0 /100 | #12 | Exceptional 10.9% |
| Immigrants | South Central Asia | 100.0 /100 | #13 | Exceptional 10.9% |
| Chinese | 100.0 /100 | #14 | Exceptional 11.0% |
| Koreans | 100.0 /100 | #15 | Exceptional 11.0% |
Demographics Similar to Barbadians by Single Male Poverty
In terms of single male poverty, the demographic groups most similar to Barbadians are Carpatho Rusyn (13.4%, a difference of 0.050%), Immigrants from Germany (13.4%, a difference of 0.060%), Belizean (13.4%, a difference of 0.17%), Immigrants from Senegal (13.5%, a difference of 0.28%), and Czechoslovakian (13.4%, a difference of 0.47%).
| Demographics | Rating | Rank | Single Male Poverty |
| Luxembourgers | 3.6 /100 | #236 | Tragic 13.4% |
| British West Indians | 3.4 /100 | #237 | Tragic 13.4% |
| Immigrants | Ghana | 3.2 /100 | #238 | Tragic 13.4% |
| Czechoslovakians | 3.0 /100 | #239 | Tragic 13.4% |
| Belizeans | 2.3 /100 | #240 | Tragic 13.4% |
| Immigrants | Germany | 2.1 /100 | #241 | Tragic 13.4% |
| Carpatho Rusyns | 2.1 /100 | #242 | Tragic 13.4% |
| Barbadians | 2.1 /100 | #243 | Tragic 13.4% |
| Immigrants | Senegal | 1.7 /100 | #244 | Tragic 13.5% |
| Immigrants | Latin America | 1.3 /100 | #245 | Tragic 13.5% |
| Immigrants | Micronesia | 1.2 /100 | #246 | Tragic 13.5% |
| Belgians | 1.2 /100 | #247 | Tragic 13.5% |
| Czechs | 1.2 /100 | #248 | Tragic 13.5% |
| Spanish | 1.0 /100 | #249 | Tragic 13.6% |
| Immigrants | Somalia | 1.0 /100 | #250 | Tragic 13.6% |