Filipino vs Immigrants from Colombia Child Poverty Under the Age of 16
COMPARE
Filipino
Immigrants from Colombia
Child Poverty Under the Age of 16
Child Poverty Under the Age of 16 Comparison
Filipinos
Immigrants from Colombia
11.1%
CHILD POVERTY UNDER THE AGE OF 16
100.0/ 100
METRIC RATING
3rd/ 347
METRIC RANK
16.1%
CHILD POVERTY UNDER THE AGE OF 16
54.4/ 100
METRIC RATING
170th/ 347
METRIC RANK
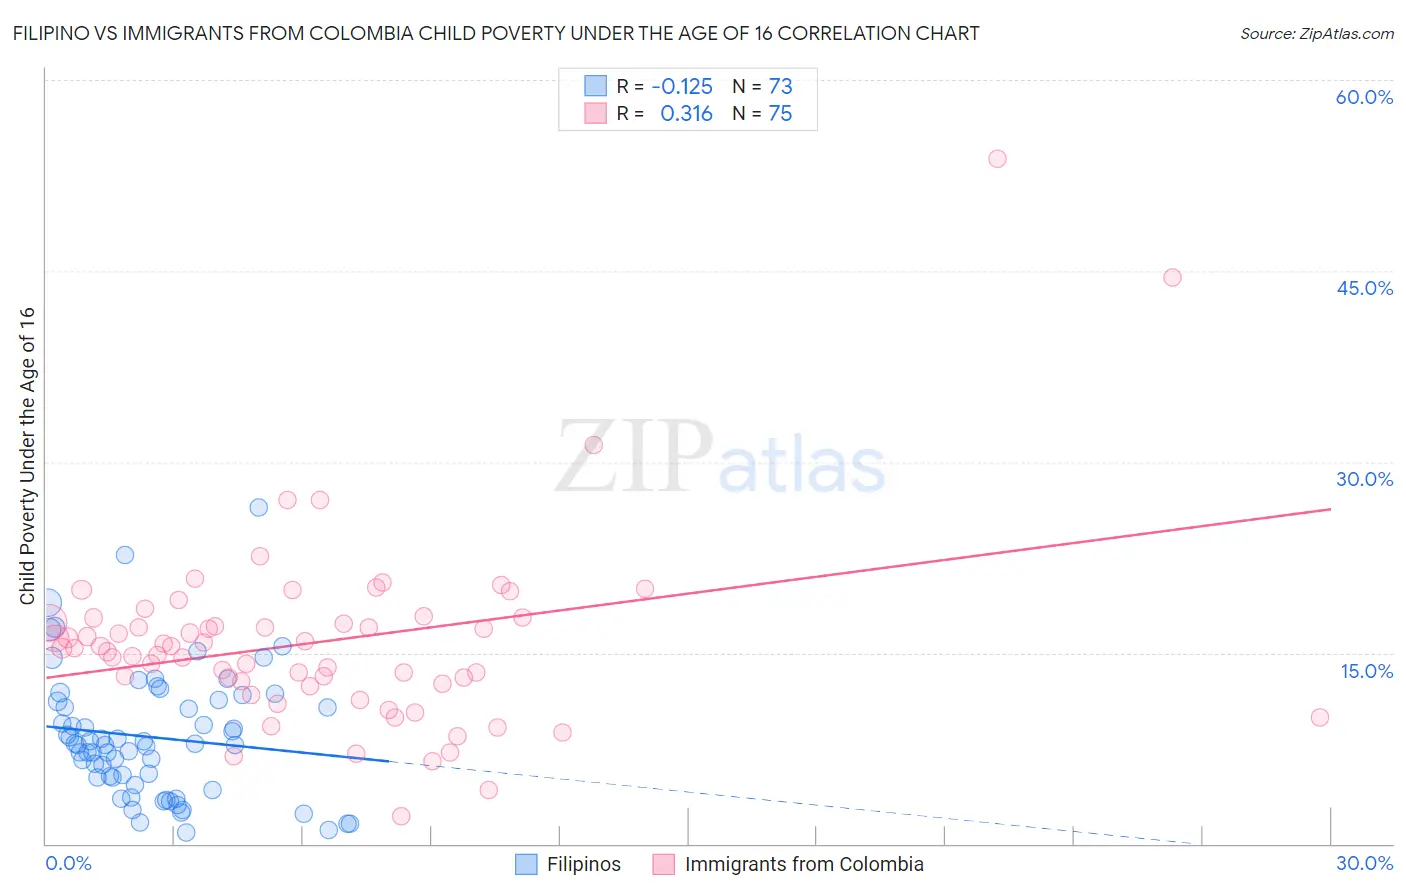
Filipino vs Immigrants from Colombia Child Poverty Under the Age of 16 Correlation Chart
The statistical analysis conducted on geographies consisting of 252,527,529 people shows a poor negative correlation between the proportion of Filipinos and poverty level among children under the age of 16 in the United States with a correlation coefficient (R) of -0.125 and weighted average of 11.1%. Similarly, the statistical analysis conducted on geographies consisting of 375,713,281 people shows a mild positive correlation between the proportion of Immigrants from Colombia and poverty level among children under the age of 16 in the United States with a correlation coefficient (R) of 0.316 and weighted average of 16.1%, a difference of 44.8%.
Child Poverty Under the Age of 16 Correlation Summary
| Measurement | Filipino | Immigrants from Colombia |
| Minimum | 0.84% | 2.1% |
| Maximum | 26.4% | 53.8% |
| Range | 25.5% | 51.7% |
| Mean | 8.4% | 15.9% |
| Median | 7.8% | 15.4% |
| Interquartile 25% (IQ1) | 4.9% | 12.5% |
| Interquartile 75% (IQ3) | 11.2% | 17.7% |
| Interquartile Range (IQR) | 6.3% | 5.2% |
| Standard Deviation (Sample) | 5.0% | 7.5% |
| Standard Deviation (Population) | 4.9% | 7.4% |
Similar Demographics by Child Poverty Under the Age of 16
Demographics Similar to Filipinos by Child Poverty Under the Age of 16
In terms of child poverty under the age of 16, the demographic groups most similar to Filipinos are Immigrants from Taiwan (11.0%, a difference of 0.85%), Immigrants from India (10.8%, a difference of 3.4%), Thai (11.6%, a difference of 3.9%), Chinese (11.9%, a difference of 7.1%), and Immigrants from Hong Kong (12.1%, a difference of 9.0%).
| Demographics | Rating | Rank | Child Poverty Under the Age of 16 |
| Immigrants | India | 100.0 /100 | #1 | Exceptional 10.8% |
| Immigrants | Taiwan | 100.0 /100 | #2 | Exceptional 11.0% |
| Filipinos | 100.0 /100 | #3 | Exceptional 11.1% |
| Thais | 100.0 /100 | #4 | Exceptional 11.6% |
| Chinese | 100.0 /100 | #5 | Exceptional 11.9% |
| Immigrants | Hong Kong | 100.0 /100 | #6 | Exceptional 12.1% |
| Iranians | 100.0 /100 | #7 | Exceptional 12.2% |
| Immigrants | Singapore | 100.0 /100 | #8 | Exceptional 12.4% |
| Immigrants | Iran | 100.0 /100 | #9 | Exceptional 12.4% |
| Immigrants | South Central Asia | 99.9 /100 | #10 | Exceptional 12.5% |
| Bhutanese | 99.9 /100 | #11 | Exceptional 12.5% |
| Immigrants | Ireland | 99.9 /100 | #12 | Exceptional 12.7% |
| Burmese | 99.9 /100 | #13 | Exceptional 12.8% |
| Immigrants | Lithuania | 99.9 /100 | #14 | Exceptional 12.9% |
| Immigrants | Korea | 99.9 /100 | #15 | Exceptional 13.0% |
Demographics Similar to Immigrants from Colombia by Child Poverty Under the Age of 16
In terms of child poverty under the age of 16, the demographic groups most similar to Immigrants from Colombia are Uruguayan (16.1%, a difference of 0.040%), Hungarian (16.2%, a difference of 0.23%), Afghan (16.2%, a difference of 0.26%), Immigrants from Saudi Arabia (16.2%, a difference of 0.28%), and South American (16.0%, a difference of 0.43%).
| Demographics | Rating | Rank | Child Poverty Under the Age of 16 |
| Yugoslavians | 67.6 /100 | #163 | Good 15.8% |
| Immigrants | Germany | 67.3 /100 | #164 | Good 15.8% |
| Guamanians/Chamorros | 66.4 /100 | #165 | Good 15.9% |
| Immigrants | Oceania | 65.4 /100 | #166 | Good 15.9% |
| Costa Ricans | 61.1 /100 | #167 | Good 16.0% |
| South Americans | 57.9 /100 | #168 | Average 16.0% |
| Uruguayans | 54.7 /100 | #169 | Average 16.1% |
| Immigrants | Colombia | 54.4 /100 | #170 | Average 16.1% |
| Hungarians | 52.5 /100 | #171 | Average 16.2% |
| Afghans | 52.3 /100 | #172 | Average 16.2% |
| Immigrants | Saudi Arabia | 52.1 /100 | #173 | Average 16.2% |
| Whites/Caucasians | 50.0 /100 | #174 | Average 16.2% |
| Scotch-Irish | 47.1 /100 | #175 | Average 16.3% |
| Lebanese | 45.9 /100 | #176 | Average 16.3% |
| Ethiopians | 43.4 /100 | #177 | Average 16.3% |