Fijian vs South American Indian Family Poverty
COMPARE
Fijian
South American Indian
Family Poverty
Family Poverty Comparison
Fijians
South American Indians
10.1%
FAMILY POVERTY
2.1/ 100
METRIC RATING
233rd/ 347
METRIC RANK
9.1%
FAMILY POVERTY
38.7/ 100
METRIC RATING
184th/ 347
METRIC RANK
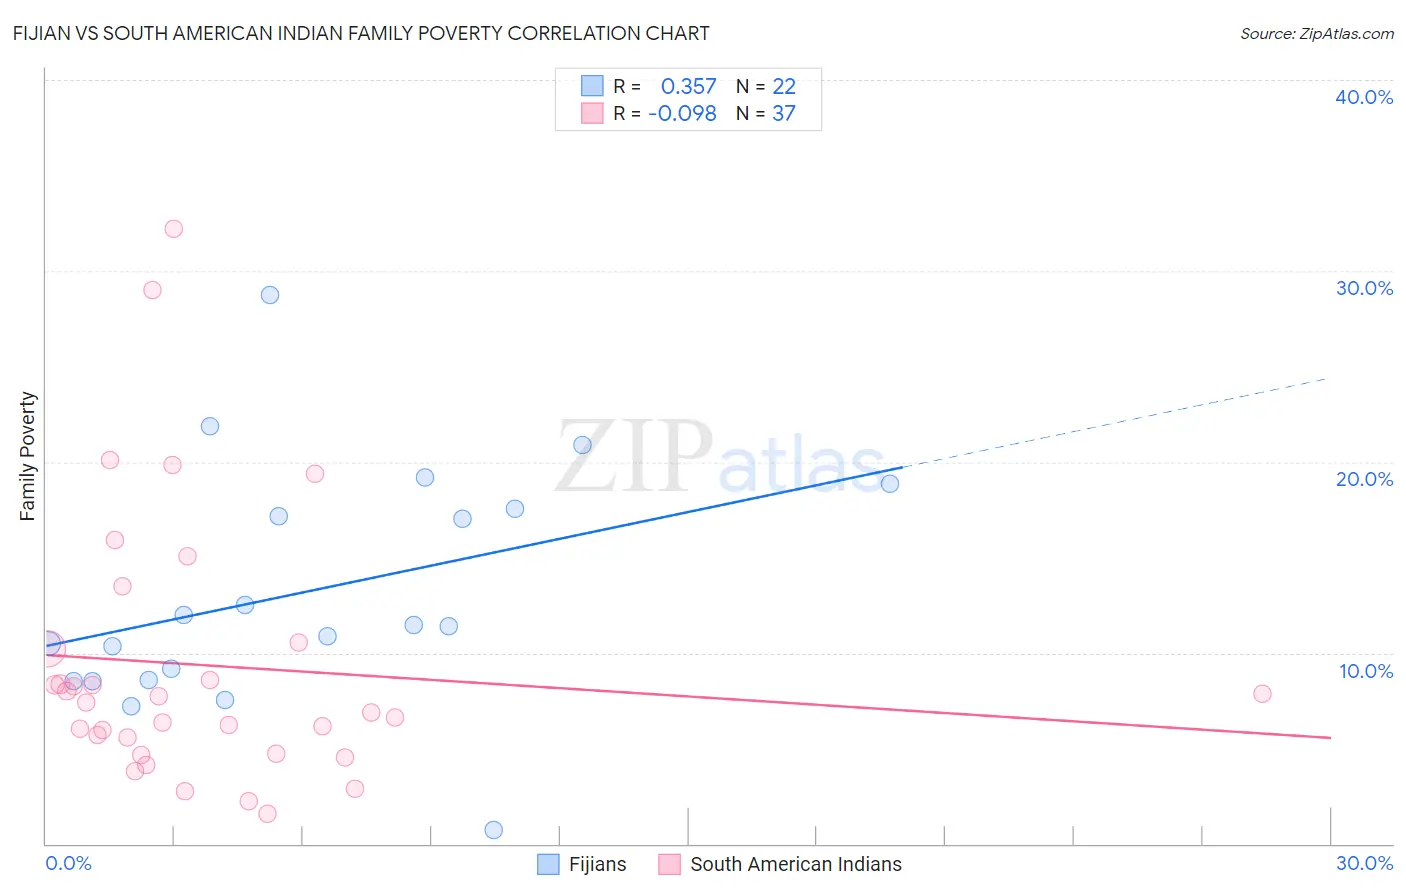
Fijian vs South American Indian Family Poverty Correlation Chart
The statistical analysis conducted on geographies consisting of 55,925,682 people shows a mild positive correlation between the proportion of Fijians and poverty level among families in the United States with a correlation coefficient (R) of 0.357 and weighted average of 10.1%. Similarly, the statistical analysis conducted on geographies consisting of 164,455,459 people shows a slight negative correlation between the proportion of South American Indians and poverty level among families in the United States with a correlation coefficient (R) of -0.098 and weighted average of 9.1%, a difference of 10.8%.
Family Poverty Correlation Summary
| Measurement | Fijian | South American Indian |
| Minimum | 0.73% | 1.6% |
| Maximum | 28.8% | 32.2% |
| Range | 28.0% | 30.7% |
| Mean | 13.2% | 9.3% |
| Median | 11.4% | 7.4% |
| Interquartile 25% (IQ1) | 8.6% | 5.1% |
| Interquartile 75% (IQ3) | 17.5% | 10.4% |
| Interquartile Range (IQR) | 8.9% | 5.2% |
| Standard Deviation (Sample) | 6.3% | 7.0% |
| Standard Deviation (Population) | 6.1% | 6.9% |
Similar Demographics by Family Poverty
Demographics Similar to Fijians by Family Poverty
In terms of family poverty, the demographic groups most similar to Fijians are Immigrants from Middle Africa (10.1%, a difference of 0.11%), Nigerian (10.1%, a difference of 0.14%), Immigrants from Sudan (10.1%, a difference of 0.25%), Immigrants from Nigeria (10.2%, a difference of 0.39%), and Immigrants from Laos (10.2%, a difference of 0.65%).
| Demographics | Rating | Rank | Family Poverty |
| Ottawa | 3.3 /100 | #226 | Tragic 10.0% |
| Immigrants | Armenia | 3.3 /100 | #227 | Tragic 10.0% |
| Sudanese | 3.1 /100 | #228 | Tragic 10.0% |
| Immigrants | Uzbekistan | 3.1 /100 | #229 | Tragic 10.0% |
| Immigrants | Panama | 3.1 /100 | #230 | Tragic 10.0% |
| Alaskan Athabascans | 2.7 /100 | #231 | Tragic 10.1% |
| Immigrants | Sudan | 2.3 /100 | #232 | Tragic 10.1% |
| Fijians | 2.1 /100 | #233 | Tragic 10.1% |
| Immigrants | Middle Africa | 2.1 /100 | #234 | Tragic 10.1% |
| Nigerians | 2.0 /100 | #235 | Tragic 10.1% |
| Immigrants | Nigeria | 1.9 /100 | #236 | Tragic 10.2% |
| Immigrants | Laos | 1.7 /100 | #237 | Tragic 10.2% |
| French American Indians | 1.5 /100 | #238 | Tragic 10.2% |
| Potawatomi | 1.5 /100 | #239 | Tragic 10.2% |
| Immigrants | Azores | 1.4 /100 | #240 | Tragic 10.3% |
Demographics Similar to South American Indians by Family Poverty
In terms of family poverty, the demographic groups most similar to South American Indians are Immigrants from Saudi Arabia (9.1%, a difference of 0.010%), Uruguayan (9.1%, a difference of 0.070%), Immigrants from Morocco (9.1%, a difference of 0.20%), Hmong (9.1%, a difference of 0.21%), and Colombian (9.2%, a difference of 0.36%).
| Demographics | Rating | Rank | Family Poverty |
| Hawaiians | 47.2 /100 | #177 | Average 9.0% |
| Immigrants | Cameroon | 47.1 /100 | #178 | Average 9.0% |
| Immigrants | Iraq | 44.4 /100 | #179 | Average 9.1% |
| Immigrants | Uganda | 43.4 /100 | #180 | Average 9.1% |
| Hmong | 40.2 /100 | #181 | Average 9.1% |
| Immigrants | Morocco | 40.2 /100 | #182 | Average 9.1% |
| Uruguayans | 39.2 /100 | #183 | Fair 9.1% |
| South American Indians | 38.7 /100 | #184 | Fair 9.1% |
| Immigrants | Saudi Arabia | 38.6 /100 | #185 | Fair 9.1% |
| Colombians | 36.1 /100 | #186 | Fair 9.2% |
| Delaware | 35.4 /100 | #187 | Fair 9.2% |
| Immigrants | Kenya | 34.0 /100 | #188 | Fair 9.2% |
| Immigrants | Afghanistan | 32.1 /100 | #189 | Fair 9.2% |
| Arabs | 31.5 /100 | #190 | Fair 9.2% |
| Ugandans | 28.7 /100 | #191 | Fair 9.3% |