Ecuadorian vs Immigrants from Uruguay Female Poverty
COMPARE
Ecuadorian
Immigrants from Uruguay
Female Poverty
Female Poverty Comparison
Ecuadorians
Immigrants from Uruguay
15.3%
FEMALE POVERTY
0.3/ 100
METRIC RATING
244th/ 347
METRIC RANK
14.0%
FEMALE POVERTY
14.0/ 100
METRIC RATING
206th/ 347
METRIC RANK
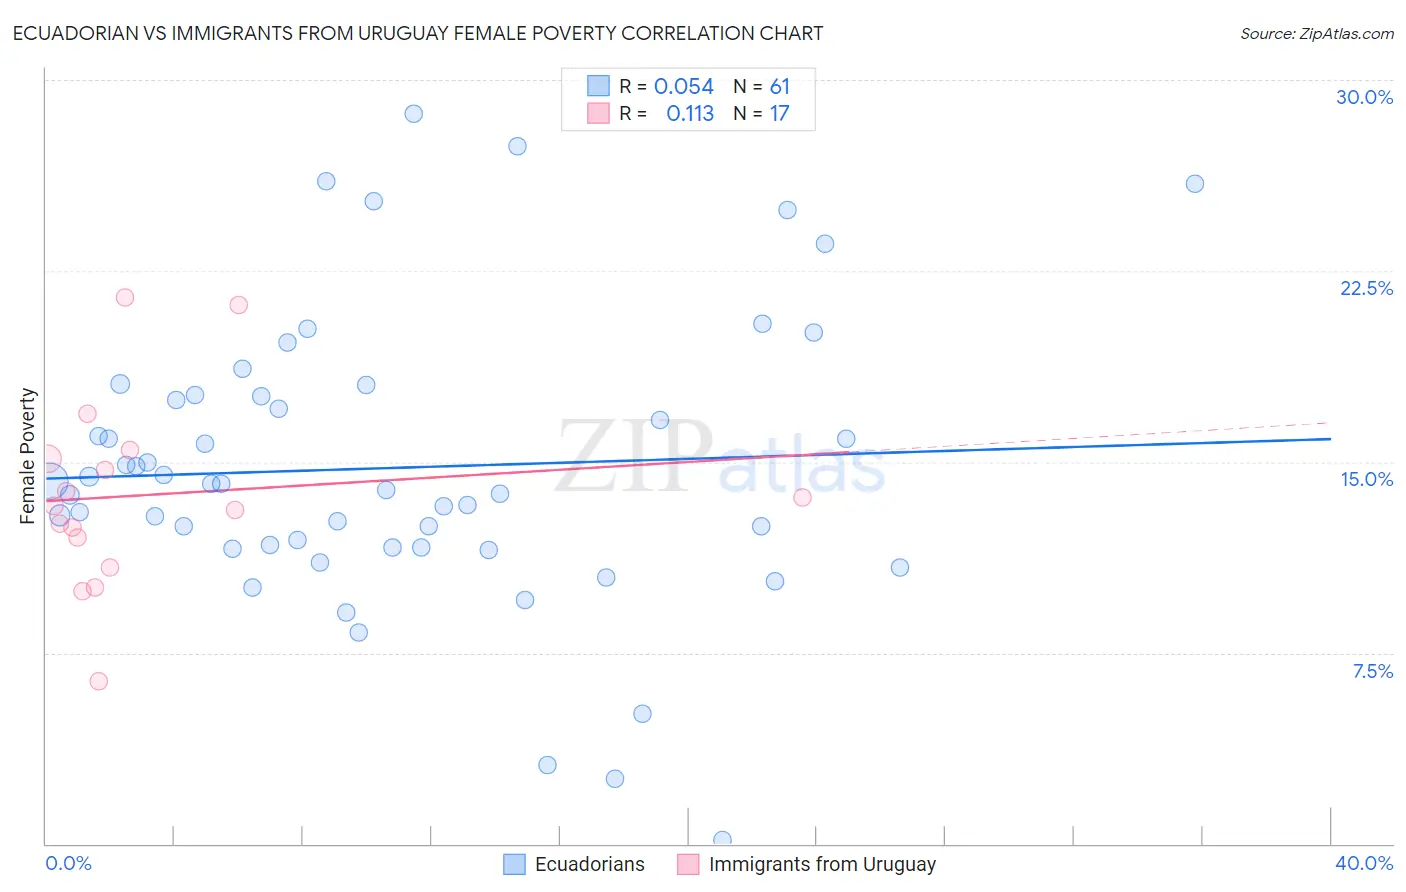
Ecuadorian vs Immigrants from Uruguay Female Poverty Correlation Chart
The statistical analysis conducted on geographies consisting of 317,585,196 people shows a slight positive correlation between the proportion of Ecuadorians and poverty level among females in the United States with a correlation coefficient (R) of 0.054 and weighted average of 15.3%. Similarly, the statistical analysis conducted on geographies consisting of 133,241,940 people shows a poor positive correlation between the proportion of Immigrants from Uruguay and poverty level among females in the United States with a correlation coefficient (R) of 0.113 and weighted average of 14.0%, a difference of 8.9%.
Female Poverty Correlation Summary
| Measurement | Ecuadorian | Immigrants from Uruguay |
| Minimum | 0.14% | 6.4% |
| Maximum | 28.7% | 21.5% |
| Range | 28.5% | 15.1% |
| Mean | 14.8% | 13.7% |
| Median | 14.1% | 13.3% |
| Interquartile 25% (IQ1) | 11.7% | 11.4% |
| Interquartile 75% (IQ3) | 17.6% | 15.3% |
| Interquartile Range (IQR) | 5.9% | 3.9% |
| Standard Deviation (Sample) | 5.7% | 3.8% |
| Standard Deviation (Population) | 5.7% | 3.7% |
Similar Demographics by Female Poverty
Demographics Similar to Ecuadorians by Female Poverty
In terms of female poverty, the demographic groups most similar to Ecuadorians are Nicaraguan (15.3%, a difference of 0.050%), Spanish American Indian (15.3%, a difference of 0.090%), Cuban (15.3%, a difference of 0.15%), Potawatomi (15.3%, a difference of 0.16%), and Immigrants from Ghana (15.3%, a difference of 0.16%).
| Demographics | Rating | Rank | Female Poverty |
| French American Indians | 0.6 /100 | #237 | Tragic 15.1% |
| Immigrants | Armenia | 0.6 /100 | #238 | Tragic 15.1% |
| Immigrants | Middle Africa | 0.5 /100 | #239 | Tragic 15.2% |
| Sudanese | 0.5 /100 | #240 | Tragic 15.2% |
| Immigrants | Sudan | 0.4 /100 | #241 | Tragic 15.2% |
| Nepalese | 0.4 /100 | #242 | Tragic 15.2% |
| Nicaraguans | 0.3 /100 | #243 | Tragic 15.3% |
| Ecuadorians | 0.3 /100 | #244 | Tragic 15.3% |
| Spanish American Indians | 0.3 /100 | #245 | Tragic 15.3% |
| Cubans | 0.3 /100 | #246 | Tragic 15.3% |
| Potawatomi | 0.3 /100 | #247 | Tragic 15.3% |
| Immigrants | Ghana | 0.3 /100 | #248 | Tragic 15.3% |
| Salvadorans | 0.3 /100 | #249 | Tragic 15.3% |
| Immigrants | Western Africa | 0.3 /100 | #250 | Tragic 15.3% |
| Immigrants | Trinidad and Tobago | 0.3 /100 | #251 | Tragic 15.4% |
Demographics Similar to Immigrants from Uruguay by Female Poverty
In terms of female poverty, the demographic groups most similar to Immigrants from Uruguay are Ugandan (14.0%, a difference of 0.27%), Spaniard (13.9%, a difference of 0.84%), Immigrants from Western Asia (13.9%, a difference of 1.1%), Immigrants from Eastern Africa (14.2%, a difference of 1.1%), and Hmong (13.9%, a difference of 1.2%).
| Demographics | Rating | Rank | Female Poverty |
| Immigrants | Lebanon | 25.6 /100 | #199 | Fair 13.8% |
| Spanish | 21.4 /100 | #200 | Fair 13.9% |
| Immigrants | Kenya | 21.1 /100 | #201 | Fair 13.9% |
| Hmong | 21.1 /100 | #202 | Fair 13.9% |
| Immigrants | Western Asia | 20.7 /100 | #203 | Fair 13.9% |
| Spaniards | 18.9 /100 | #204 | Poor 13.9% |
| Ugandans | 15.4 /100 | #205 | Poor 14.0% |
| Immigrants | Uruguay | 14.0 /100 | #206 | Poor 14.0% |
| Immigrants | Eastern Africa | 9.0 /100 | #207 | Tragic 14.2% |
| Immigrants | Azores | 7.9 /100 | #208 | Tragic 14.2% |
| Panamanians | 7.7 /100 | #209 | Tragic 14.2% |
| Malaysians | 7.4 /100 | #210 | Tragic 14.3% |
| Moroccans | 7.2 /100 | #211 | Tragic 14.3% |
| Bermudans | 5.5 /100 | #212 | Tragic 14.4% |
| Alaskan Athabascans | 5.3 /100 | #213 | Tragic 14.4% |