Dutch West Indian vs Immigrants from Eastern Europe Single Mother Poverty
COMPARE
Dutch West Indian
Immigrants from Eastern Europe
Single Mother Poverty
Single Mother Poverty Comparison
Dutch West Indians
Immigrants from Eastern Europe
36.8%
SINGLE MOTHER POVERTY
0.0/ 100
METRIC RATING
332nd/ 347
METRIC RANK
27.2%
SINGLE MOTHER POVERTY
99.6/ 100
METRIC RATING
61st/ 347
METRIC RANK
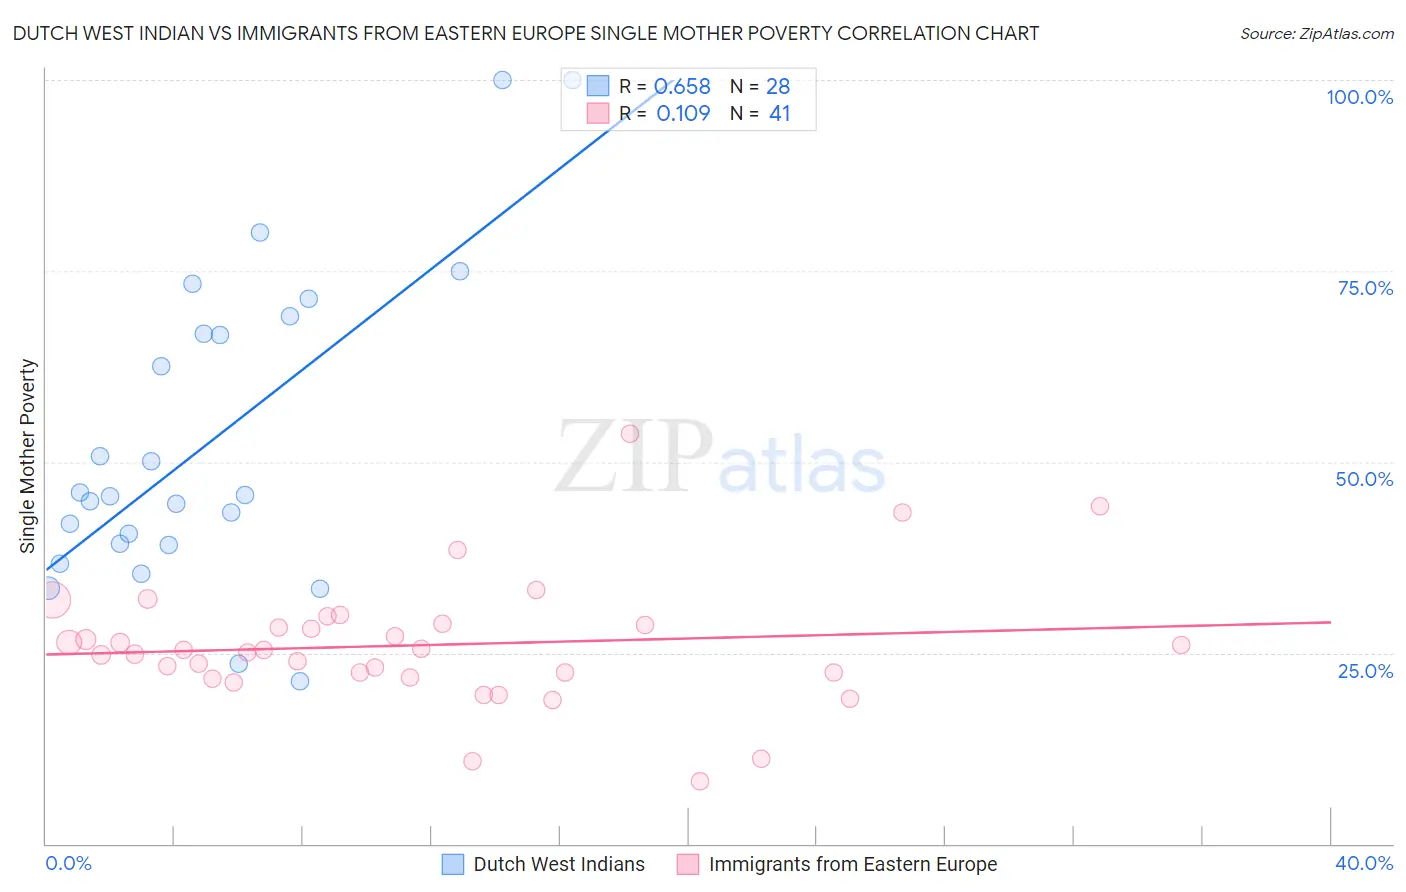
Dutch West Indian vs Immigrants from Eastern Europe Single Mother Poverty Correlation Chart
The statistical analysis conducted on geographies consisting of 85,385,586 people shows a significant positive correlation between the proportion of Dutch West Indians and poverty level among single mothers in the United States with a correlation coefficient (R) of 0.658 and weighted average of 36.8%. Similarly, the statistical analysis conducted on geographies consisting of 458,466,379 people shows a poor positive correlation between the proportion of Immigrants from Eastern Europe and poverty level among single mothers in the United States with a correlation coefficient (R) of 0.109 and weighted average of 27.2%, a difference of 34.9%.
Single Mother Poverty Correlation Summary
| Measurement | Dutch West Indian | Immigrants from Eastern Europe |
| Minimum | 21.3% | 8.1% |
| Maximum | 100.0% | 53.6% |
| Range | 78.7% | 45.5% |
| Mean | 52.8% | 26.0% |
| Median | 45.6% | 25.4% |
| Interquartile 25% (IQ1) | 39.2% | 22.1% |
| Interquartile 75% (IQ3) | 67.9% | 28.7% |
| Interquartile Range (IQR) | 28.7% | 6.6% |
| Standard Deviation (Sample) | 20.5% | 8.4% |
| Standard Deviation (Population) | 20.2% | 8.3% |
Similar Demographics by Single Mother Poverty
Demographics Similar to Dutch West Indians by Single Mother Poverty
In terms of single mother poverty, the demographic groups most similar to Dutch West Indians are Creek (36.7%, a difference of 0.24%), Native/Alaskan (36.6%, a difference of 0.40%), Apache (36.6%, a difference of 0.50%), Menominee (37.1%, a difference of 0.78%), and Choctaw (36.4%, a difference of 0.98%).
| Demographics | Rating | Rank | Single Mother Poverty |
| Ute | 0.0 /100 | #325 | Tragic 35.7% |
| Seminole | 0.0 /100 | #326 | Tragic 35.8% |
| Yakama | 0.0 /100 | #327 | Tragic 36.4% |
| Choctaw | 0.0 /100 | #328 | Tragic 36.4% |
| Apache | 0.0 /100 | #329 | Tragic 36.6% |
| Natives/Alaskans | 0.0 /100 | #330 | Tragic 36.6% |
| Creek | 0.0 /100 | #331 | Tragic 36.7% |
| Dutch West Indians | 0.0 /100 | #332 | Tragic 36.8% |
| Menominee | 0.0 /100 | #333 | Tragic 37.1% |
| Pueblo | 0.0 /100 | #334 | Tragic 37.2% |
| Yuman | 0.0 /100 | #335 | Tragic 37.8% |
| Cheyenne | 0.0 /100 | #336 | Tragic 38.5% |
| Immigrants | Yemen | 0.0 /100 | #337 | Tragic 38.5% |
| Pima | 0.0 /100 | #338 | Tragic 38.6% |
| Crow | 0.0 /100 | #339 | Tragic 38.6% |
Demographics Similar to Immigrants from Eastern Europe by Single Mother Poverty
In terms of single mother poverty, the demographic groups most similar to Immigrants from Eastern Europe are Eastern European (27.2%, a difference of 0.11%), Immigrants from Malaysia (27.3%, a difference of 0.14%), Paraguayan (27.2%, a difference of 0.15%), Argentinean (27.2%, a difference of 0.16%), and Immigrants from Northern Europe (27.3%, a difference of 0.18%).
| Demographics | Rating | Rank | Single Mother Poverty |
| Immigrants | Bulgaria | 99.7 /100 | #54 | Exceptional 27.1% |
| Immigrants | Egypt | 99.7 /100 | #55 | Exceptional 27.1% |
| Immigrants | Romania | 99.7 /100 | #56 | Exceptional 27.2% |
| Palestinians | 99.7 /100 | #57 | Exceptional 27.2% |
| Argentineans | 99.6 /100 | #58 | Exceptional 27.2% |
| Paraguayans | 99.6 /100 | #59 | Exceptional 27.2% |
| Eastern Europeans | 99.6 /100 | #60 | Exceptional 27.2% |
| Immigrants | Eastern Europe | 99.6 /100 | #61 | Exceptional 27.2% |
| Immigrants | Malaysia | 99.5 /100 | #62 | Exceptional 27.3% |
| Immigrants | Northern Europe | 99.5 /100 | #63 | Exceptional 27.3% |
| Russians | 99.5 /100 | #64 | Exceptional 27.3% |
| Immigrants | Turkey | 99.5 /100 | #65 | Exceptional 27.3% |
| Soviet Union | 99.5 /100 | #66 | Exceptional 27.3% |
| Immigrants | Australia | 99.5 /100 | #67 | Exceptional 27.3% |
| Immigrants | Czechoslovakia | 99.5 /100 | #68 | Exceptional 27.4% |