Dutch vs Immigrants from Austria Child Poverty Among Girls Under 16
COMPARE
Dutch
Immigrants from Austria
Child Poverty Among Girls Under 16
Child Poverty Among Girls Under 16 Comparison
Dutch
Immigrants from Austria
15.1%
CHILD POVERTY AMONG GIRLS UNDER 16
94.3/ 100
METRIC RATING
113th/ 347
METRIC RANK
14.6%
CHILD POVERTY AMONG GIRLS UNDER 16
98.0/ 100
METRIC RATING
73rd/ 347
METRIC RANK
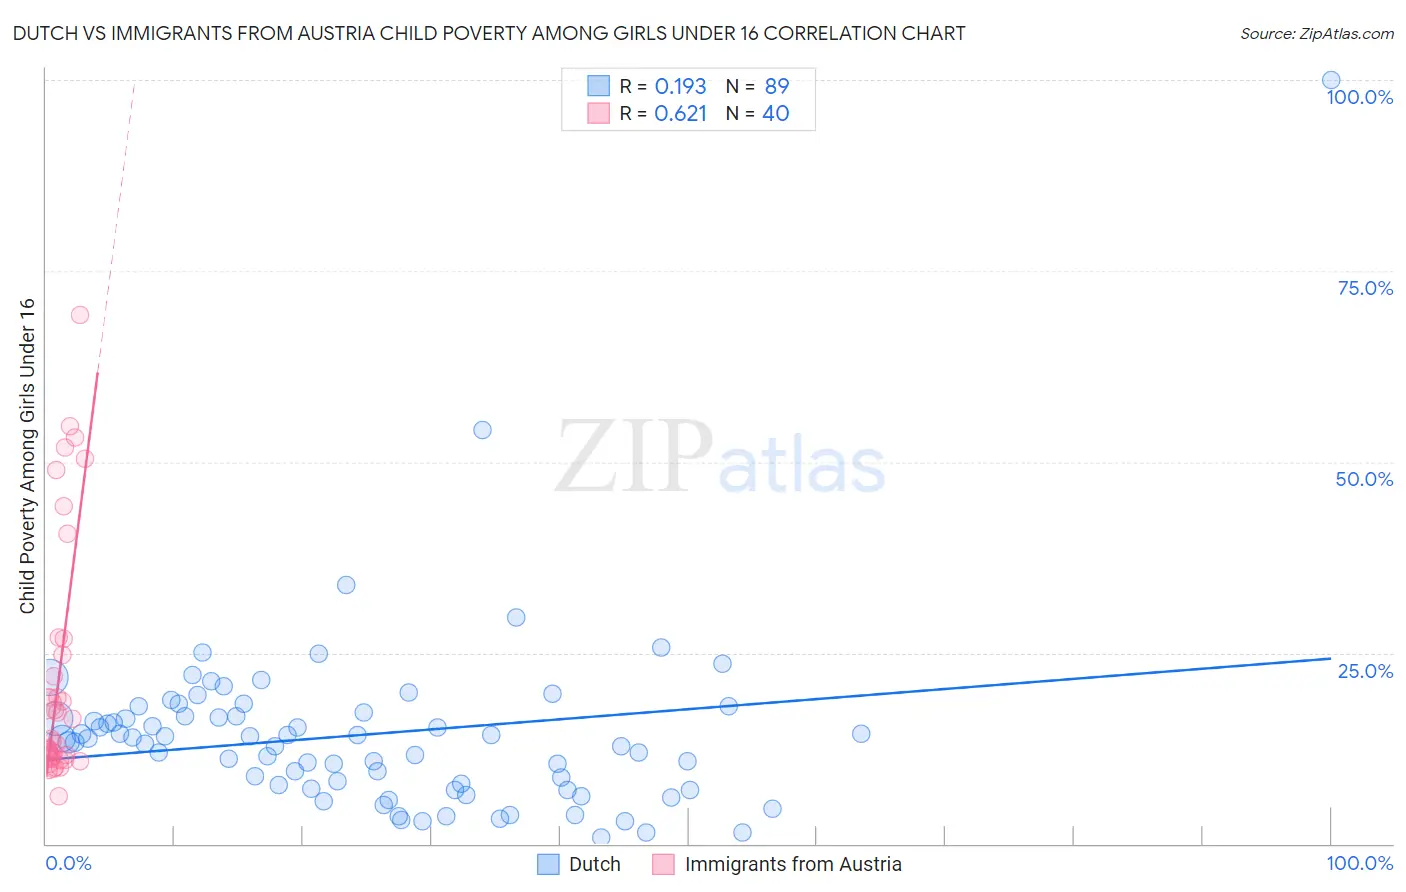
Dutch vs Immigrants from Austria Child Poverty Among Girls Under 16 Correlation Chart
The statistical analysis conducted on geographies consisting of 533,855,440 people shows a poor positive correlation between the proportion of Dutch and poverty level among girls under the age of 16 in the United States with a correlation coefficient (R) of 0.193 and weighted average of 15.1%. Similarly, the statistical analysis conducted on geographies consisting of 165,793,314 people shows a significant positive correlation between the proportion of Immigrants from Austria and poverty level among girls under the age of 16 in the United States with a correlation coefficient (R) of 0.621 and weighted average of 14.6%, a difference of 3.6%.
Child Poverty Among Girls Under 16 Correlation Summary
| Measurement | Dutch | Immigrants from Austria |
| Minimum | 0.74% | 6.2% |
| Maximum | 100.0% | 69.2% |
| Range | 99.3% | 63.0% |
| Mean | 14.3% | 21.9% |
| Median | 13.8% | 13.6% |
| Interquartile 25% (IQ1) | 7.4% | 11.2% |
| Interquartile 75% (IQ3) | 17.0% | 25.8% |
| Interquartile Range (IQR) | 9.5% | 14.6% |
| Standard Deviation (Sample) | 12.2% | 16.2% |
| Standard Deviation (Population) | 12.1% | 16.0% |
Similar Demographics by Child Poverty Among Girls Under 16
Demographics Similar to Dutch by Child Poverty Among Girls Under 16
In terms of child poverty among girls under 16, the demographic groups most similar to Dutch are Immigrants from Kazakhstan (15.1%, a difference of 0.020%), Sri Lankan (15.2%, a difference of 0.13%), Palestinian (15.1%, a difference of 0.16%), Belgian (15.2%, a difference of 0.19%), and Immigrants from Croatia (15.1%, a difference of 0.20%).
| Demographics | Rating | Rank | Child Poverty Among Girls Under 16 |
| Chileans | 95.1 /100 | #106 | Exceptional 15.1% |
| Immigrants | Ukraine | 95.0 /100 | #107 | Exceptional 15.1% |
| Immigrants | Brazil | 94.9 /100 | #108 | Exceptional 15.1% |
| Serbians | 94.8 /100 | #109 | Exceptional 15.1% |
| Immigrants | Croatia | 94.6 /100 | #110 | Exceptional 15.1% |
| Palestinians | 94.5 /100 | #111 | Exceptional 15.1% |
| Immigrants | Kazakhstan | 94.3 /100 | #112 | Exceptional 15.1% |
| Dutch | 94.3 /100 | #113 | Exceptional 15.1% |
| Sri Lankans | 94.0 /100 | #114 | Exceptional 15.2% |
| Belgians | 93.9 /100 | #115 | Exceptional 15.2% |
| Immigrants | Denmark | 93.3 /100 | #116 | Exceptional 15.2% |
| Immigrants | North Macedonia | 93.1 /100 | #117 | Exceptional 15.2% |
| Immigrants | Southern Europe | 92.7 /100 | #118 | Exceptional 15.3% |
| Immigrants | Zimbabwe | 92.5 /100 | #119 | Exceptional 15.3% |
| Pakistanis | 92.3 /100 | #120 | Exceptional 15.3% |
Demographics Similar to Immigrants from Austria by Child Poverty Among Girls Under 16
In terms of child poverty among girls under 16, the demographic groups most similar to Immigrants from Austria are Taiwanese (14.6%, a difference of 0.030%), Immigrants from Netherlands (14.6%, a difference of 0.090%), Immigrants from Eastern Europe (14.6%, a difference of 0.10%), Slovene (14.6%, a difference of 0.12%), and European (14.6%, a difference of 0.16%).
| Demographics | Rating | Rank | Child Poverty Among Girls Under 16 |
| Immigrants | Belgium | 98.5 /100 | #66 | Exceptional 14.5% |
| Laotians | 98.4 /100 | #67 | Exceptional 14.5% |
| Immigrants | Argentina | 98.3 /100 | #68 | Exceptional 14.6% |
| Immigrants | Poland | 98.2 /100 | #69 | Exceptional 14.6% |
| Europeans | 98.1 /100 | #70 | Exceptional 14.6% |
| Slovenes | 98.1 /100 | #71 | Exceptional 14.6% |
| Immigrants | Netherlands | 98.1 /100 | #72 | Exceptional 14.6% |
| Immigrants | Austria | 98.0 /100 | #73 | Exceptional 14.6% |
| Taiwanese | 98.0 /100 | #74 | Exceptional 14.6% |
| Immigrants | Eastern Europe | 98.0 /100 | #75 | Exceptional 14.6% |
| Immigrants | Russia | 97.9 /100 | #76 | Exceptional 14.7% |
| Tlingit-Haida | 97.9 /100 | #77 | Exceptional 14.7% |
| Argentineans | 97.9 /100 | #78 | Exceptional 14.7% |
| Immigrants | Turkey | 97.9 /100 | #79 | Exceptional 14.7% |
| Egyptians | 97.9 /100 | #80 | Exceptional 14.7% |